The Modo Energy GB and European forecast of power prices and battery revenues updates every quarter. Here is a summary of the changes from one version to the next.
October 2026 release (update from July 2026)
Key changes:
-
In GB, average annual battery revenue falls 1–4%, and net present value at a 10% discount rate falls 0.4% on average. See the GB BESS release article.
-
In Germany, cumulative 2027–2041 revenue for an unconstrained 50 MW battery rises 6.3% for 2 hours and is flat for 4 hours, at −0.4%. See the Germany BESS, solar and wind and schedule freeze release articles.
-
In Spain, cumulative 2028–2045 revenue is flat for 2-hour and 4-hour batteries. A 4-hour standalone battery earns 12% more in 2028, then up to 6% less over 2030–2037. See the Spain BESS release article.
-
In Italy, average 2027–2040 Central case revenue for a 4-hour battery rises in every zone except the North, from 8% in Calabria and Sicily to 24% in Sardinia. See the Italy BESS release article.
-
In Poland, average 2027–2050 revenue for an unconstrained 50 MW battery is 12% higher for 2 hours and 2% higher for 4 hours. See the Poland BESS release article.
-
Central, Low and High scenarios are available in all five regions. See Scenarios.
Each figure uses its release article’s basis.
All regions
-
Scenarios: Low and High change gas prices, carbon prices and demand growth, and keep Central’s buildout. Low EU gas is 25% below Central in 2026 and 2027, and 15–17% below from 2030 to 2050. High mirrors Low. Demand grows at 95% of Central’s rate in Low and 103% in High. See Scenarios.
-
Gas prices are higher in the near term, as the continued closure of the Strait of Hormuz and low European gas storage lift forward prices. In 2027, EU gas averages €50.6/MWh (July: €33.0/MWh) and GB gas averages £43.6/MWh (July: £28.3/MWh).
-
Hydrogen price assumptions are revised up after 2030: the 2050 price is €59.2/MWh (July: €30.9/MWh), 92% higher.
-
Capex uses the Europe results of the Modo Energy BESS Capex Survey 2026. A 2-hour battery costs £503/kW in 2025, in real 2026 GBP (July: £618/kW, real 2025 GBP). See Model Assumptions.
-
Guarantees of Origin (GoOs) outside GB apply to 60% of each renewable fleet (July: 100%). See Renewables.
-
French nuclear follows PPE3. Capacity holds at 63.0 GW to 2030 (July: 59.4 GW) and is 50.0 GW in 2050 (July: 38.6 GW). Higher French nuclear output is one reason GB imports 10–15 TWh a year more over 2028–2030. See Nuclear.
GB
Model changes
-
Demand is 14% lower by 2050, and the two-hour top-bottom spread (TB2) is £5,500/MW/year lower in 2040. See Demand.
-
Battery fleet is 2.6 GW smaller in 2030 and 6.0 GW smaller in 2035, and 8-hour and longer batteries reach 16.2 GW in 2050 (July: 10.9 GW).
-
Solar and wind beyond their Contracts for Difference (CfDs) are chosen by the capacity expansion model. Solar is 10 GW lower by 2050, and offshore wind reaches 60 GW (July: 77 GW). See Capacity Expansion Model.
-
Hydrogen peakers reach 3.3 GW by 2050 (July: 24 GW).
-
CfD metering settles difference payments on metered generation, not export, so co-located solar can charge the battery and keep the payment.
-
Revenue calibration is refitted: 82% in Central (July: 80%), 77% in Low and 87% in High. See Model Calibration.
-
Cycling cost is a new input, with a default of £8/MWh. See GB Dispatch Model.
Battery revenues
Germany
Model changes
- Demand is 858.7 TWh in 2040 (July: 980.2 TWh), as electrolyser demand grows more slowly. See Demand.
- Hydrogen peakers are not built (July: 67 GW by 2059).
-
Grid-scale batteries reach 18.0 GW by the end of 2029 (July: 14.9 GW), ahead of the grid fee deadline.
-
Solar reaches 266 GW by 2040 (July: 340 GW). Higher gas lifts the 2027 solar capture price by 18%. See the Germany solar and wind release article.
-
Wind capture prices fall on lower baseload prices. Onshore wind captures €60.30/MWh in 2040 (July: €77.76/MWh), and wind farm revenue falls from €150k to €130k/MW/yr.
- Intraday liquidity is now a MW cap per settlement period, which falls as the flexible fleet grows and binds for batteries above 500 MW. See German Dispatch Model.
-
Schedule freeze is a new Flexible Connection Agreement (FCA) input that fixes the intraday position before delivery. A one-hour freeze removes 35% of intraday continuous volume. See the schedule freeze article.
-
Ancillary service limits are entered as the eligible share of rated power. See Flexible Connection Agreements.
-
High scenario limits new batteries to 20% ancillary participation (50% in Central).
Battery revenues
Standalone battery
Co-located battery
Solar project
Wind project
Spain
Model changes
-
Demand is 261 TWh in 2030 (July: 273 TWh).
-
Grid-scale batteries reach 8.9 GW in 2030 (July: 4.4 GW).
- Solar captures €19/MWh in 2028 for a fixed-tilt plant (July: €22/MWh).
- IVPEE generation tax follows its statutory schedule, not a flat 7%: 4.2% from October 2026, 3.5% from January 2027 and 0% from January 2028, when the tax ends. See Spanish Dispatch Model.
- Balancing energy prices (aFRR energy and TTRR P2) follow day-ahead prices in each scenario, so they are 10–20% lower in Low and 10–20% higher in High. See Scenarios.
Battery revenues
Italy
Model changes
-
Batteries in the South grow from 0.2 GW in 2026 to 3.5 GW in 2030.
-
Balancing activations in MB and aFRR energy are capped by zone, direction and hour.
-
Caps fall as more batteries share the same activated volume: by 2030, the North keeps 83% of its 2026 cap and the South 41%. See Italian Dispatch Model.
- Day-ahead revenue calibration is 85% in Central, 80% in Low and 90% in High. Intraday and balancing revenue are not scaled.
Battery revenues
Poland
Model changes
- 4-hour batteries reach 13.5 GW by 2040 (July: 6.8 GW).
- Intraday trading on TGE 15-minute continuous is a new step. Each battery takes only a share of each slot’s volume, which grows from 28.5 MW in 2026 to 420 MW by 2040. See Polish Revenue Stack.
-
mFRR capacity is co-optimised in the day-ahead step.
-
Calibration applies to forecasts: 90% in Central, 80% in Low and 100% in High. See Scenarios.
Battery revenues
July 2026 release (update from April 2026)
Key changes:
– In Germany, BESS revenues increase versus April 2026. Cumulative total revenue (EUR/MW, real 2025) is up around 8-9% over the first 5 years and around 4% over the first 25 years, depending on duration. The main driver is an update to ancillary-services participation assumptions.
– In GB, battery revenues increase by around 5-10% versus April 2026, depending on duration, location and cycling. The main driver is improved modelling of non-physical trades in the dispatch model.
– Italy and Poland BESS revenue forecasts are now available in the terminal as part of this release.
Market pricing model updates
-
BESS fleet dispatch modelling has been improved. Previously, as a proxy for differences in individual battery behaviour, the fleet’s maximum charge and discharge power varied with its fleet-wide state of charge. We now model that diversity explicitly by splitting the fleet into tranches, each with its own state-of-charge constraint and cycling cost. This produces more realistic fleet dispatch profiles and daily power-price shapes.
-
Commodity prices are updated to the latest forward curves, obtained on 3 July. Gas and carbon are generally higher in the near term versus April 2026, before converging over the longer horizon.
Updates specific to the German forecast
-
German BESS revenues rise relative to the April 2026 Central forecast. The uplift is largest over the near-term horizon and moderates over the full 25-year life, and is consistent across both a 4-hour (1.5 cycles/day) and a 2-hour (2 cycles/day) configuration.
-
Ancillary services participation has been revised. The previous assumption that all new batteries reach full FCR and aFRR participation has been reduced to around half of new capacity, reflecting ancillary limitations in the new E.ON-wide Flexible Connection Agreement and consolidation of restrictions at the TSO level. Ancillary prices saturate more slowly as a result, lifting battery revenues over the next two years. Later years are largely unchanged.
Updates specific to the GB forecast
-
GB battery revenues increase by around 5-10% compared with the April 2026 Central forecast, depending on duration, location and cycling. Most of this increase comes from improved modelling of non-physical trades in the dispatch model.
-
BESS buildout is higher from the early 2030s. The Central scenario now reaches around 36 GW by 2035, compared with 29 GW in the April forecast. The larger fleet decreases Balancing Mechanism bid and offer dispatch rates, and suppresses daily spreads throughout the 2030s.
- CCS buildout is similar to the April forecast until the mid-2030s, but lower in later years. Gas and biomass CCS capacity reaches around 29 GW by 2045, compared with 32 GW in April.
- Gas OCGT buildout is now modelled explicitly in the capacity expansion model. The Central scenario now reaches 11 GW by 2040; in the April forecast, capacity remained broadly flat before older plants retired. Together, more OCGT and less CCS in later years means that carbon costs are added to the running costs of more price-setting gas generation. This supports higher power prices and wider spreads throughout the 2040s and 50s.
Dispatch model updates
Updates specific to the GB dispatch model
-
Non-physical trading has been modelled more realistically across day-ahead, intraday and the Balancing Mechanism. This better reflects how batteries trade in practice and is the main reason revenues increase in this release. Apr-26 forecasts run from June 25th already included this change. For those forecasts, you’ll see a small decrease in revenues in the Jul-26 release.
-
Capacity Market inputs have been updated using the latest published NESO auction results. Clearing prices and storage de-rating factors now line up with Capacity Market delivery years, which run from October to September.
As before, new-build batteries are modelled with a 15-year T-4 contract. The contract starts in the first October after the battery comes online, and its clearing price and storage de-rating factor are then fixed for all 15 delivery years. Once the contract ends, the battery moves onto annual T-1 contracts.
Battery degradation is now more realistically accounted for across the full 15-year contract. The battery keeps the same registered duration band, but its registered power is set using the minimum state of health expected during the contract. A battery registers only the power it can sustain at its lowest state of health over the 15 years. This better reflects how operators maintain their contracted duration and Extended Performance Test capability.
- TNUoS tariffs and battery assumptions have been refreshed using NESO’s latest Five-Year forecast. Embedded Export Tariffs for distribution-connected batteries now use the latest regional outlook. The largest changes are in southern regions, where the previous forecast understated the value of embedded exports.
The Annual Load Factor used for transmission-connected batteries and batteries ≥100MW has increased from 3.89% to 8.05%, in line with NESO’s Final 2026/27 tariff assumptions.
Updates specific to the German dispatch model
- Ramp-rate restrictions are now modelled more flexibly. The dispatch model supports slower ramp constraints, those taking longer than 15 minutes to move across the full power range, equivalently rates below around 6.6% per minute. This better reflects the ramp-rate limits that Flexible Connection Agreements place on batteries in Germany. See Flexible Connection Agreements for more detail.
April 2026 release (update from January 2026)
Key changes:
– in GB, battery revenues change 1 to -1.5%, depending on duration and location. Drivers are: the removal of the Carbon Price Support top-up from GB thermal generator run costs, updated commodity costs, improved modelling of Electric Vehicles and a reduction in demand. Check out the articles on the details for GB BESS and for GB solar.
– In Germany, BESS lifetime revenues for a 2h asset reduce around 16% due to a more conservative intraday continuous methodology, with most of the change concentrated from 2028 onwards. Check out the articles on the details for German BESS and for German solar.
– In Spain, ancillary services and intraday revenues are projected to saturate for batteries by 2030, with 4.6 GW (13.6 GWh) projected to come online by then. Check out the articles on the details for Spanish BESS and for Spanish solar.
– Irish power prices are now available on the platform. The new Ireland forecast uses Ireland-specific capacity inputs and build constraints, plus Irish intraday calibration.
Market pricing model updates
Electric Vehicle demand is now modelled explicitly in every European country.
Country-level EV stock trajectories are built from current battery electric vehicle stock, population, vehicles per capita, a 17-year vehicle lifetime, and sales-share profiles that define the pace of EV adoption. Stock is converted to annual electricity demand using a fleet efficiency curve, fixed mileage of 12,000 km per year, and grid-side efficiency assumptions. For GB, the ground-up trajectory is anchored to FES 2025 Holistic Transition, with 1.39 million battery electric vehicles in 2024.
Annual EV demand is removed from the base demand forecast before profile shaping, then added back according to charging behaviour. Non-managed and user-managed EVs have fixed half-hourly demand profiles. Externally managed EVs do optimised smart charging, while vehicle-to-grid EVs can both charge and export. Flexible EV charging uses a 4 kW charger power assumption, a 70 kWh battery, 88% efficiency, and a time-varying plug-in availability profile. Constraints require rolling 24-hour charging to cover at least 90% of driving demand, with at least 70% of the next day’s demand charged overnight between 23:00 and 06:00 local time. Vehicle-to-grid exports are capped at 10% of total charge, and a cycling cost is applied to optimised EV charging.
For more information, see Electric Vehicles.
- Price impact: Price spreads reduce as overnight charging lifts off-peak prices; daytime solar price troughs are shallower given a small portion of the fleet is plugged in all day and charges from cheap solar.
- Revenue impact: ~1% reduction, but as there is less utility scale BESS there is also less competition for markets that EVs won’t compete - like the Balancing Mechanism. So, in some regions revenues increase.
Commodity prices are updated to the latest forward curves.
For gas, the front of curve aligned to CME forwards, reflecting a short term increase due to the Iran war. Long-term forecast unchanged from Jan 2026. There is a new curve for Coal, combining ICE API2 Rotterdam futures with the long-term scenario price via a smooth fade. Coal now varies over the forecast horizon in the same way gas does. Carbon is aligned to the latest EUA and UKA forward curves and GB Carbon Price Support has been removed, taking the £18/tonne CPS top-up from GB thermal run costs.
- Price impact: Short term increase in power prices due to gas prices, and reduction in spreads due to CPS.
- Revenue impact: Short term revenues up.
Lower solar capital and operating costs across Europe
Capex is aligned to the IRENA cost analysis. Lower build costs let the capacity expansion model select more solar in the late 2020s and 2030s, deepening daytime price troughs and widening battery spreads. The effect is most visible in Spain.
Lower demand across Europe
Demand is 3% lower in all regions vs Jan-2026. This is due to a double counting of transmission losses.
The low-case scenario has an alternate commodity price assumption on gas
This replaces the previous flat-percentage gas discount and is used in all regions. LNG glut materialises, Russian pipeline gas partially returns, and long-term European gas settles around €15/MWh.
Updates specific to the GB forecast
- The GB BESS and solar build-out are slowed in response to connections reform: new projects are anticipated to connect at a slower pace under the reformed queue process. Less BESS competition supports per-MW GB battery revenues; less solar modestly lifts GB power prices.
-
GB heat pump demand is explicitly modelled and growing adoption sharpens winter peaks without changing annual total demand. Trajectory reads from FES 2025 ED1, extrapolated to 2060. Sharper winter shapes support GB battery revenues.
-
Sizewell B is forecast to operate until 2055 (a 20 year extension), assuming it is able to secure a Contract for Difference.
-
Capacity Market revenues in GB are now explicitly modelled as T-4 15-year contracts, and assets are credited with CM revenues from October of the forecast start year. They receive that same CM revenue for 15 years. For example, an asset going live in May 2027 will get CM revenues on a T-4 contract at the price set CM year 2027/2028 from October 2027 for 15 years. The exception is for assets which have a start date in Jan 2026 (ie the earliest date of the forecast). These are likely to be operational assets and we assume it receives the 2025 T-4 price until September 2039. T-4 prices are also updated to take a more conservative view.
Updates specific to the German forecast
-
Retuned the Germany intraday noise model against January 2025 – April 2026 spreads. There is now ~3× less intraday volatility, and the volatility dynamically compresses with more batteries coming online. The resulting compressed DA–ID spreads reduce German battery revenues.
-
Updated the German central capacity buildout: the new central view shifts the medium-term German mix toward more utility-scale storage and gas, and away from some solar and wind buildout.
-
Refined ancillary services competition assumptions in the late 2020s. ME BESS indices in saturated markets were used as a benchmark.
Updates specific to the Spanish forecast
- Revised the Spain nuclear trajectory. Reactors retire at a different pace between 2028 and 2035, with more capacity retained into the mid-2030s.
-
Updated the Spanish demand forecast. Near-term aligned to ERAA 2025, long-term consistent with the Jan 2026 central view.
-
Retuned the Spain intraday noise model using a best-fit optimiser against the historical DA–ID spread distribution, with a structural intraday discount added.
Irish power prices (Day Ahead and Intraday) are now available on the platform
-
Updated the Irish capacity inputs to better reflect whole-island capacities of wind, solar and gas. There is a large near-term onshore wind and solar build, while offshore wind ramps slowly.
-
Calibrated Irish intraday price noise to SEMOpx day-ahead and intraday auction data, so modelled Irish DA–ID spreads now reflect the local market.
Dispatch model updates
-
Degrading efficiency across the forecast horizon available as a custom input
-
Custom grid or network charges are available, revamping the DUoS workflow
-
Contracts for solar forecasts are now available. Evaluate the revenues from solar generation across multiple contracts: CFDs with a customisable strike price; Fixed pay-as-produce contracts; Certificates (ROCs, RECs, GOs); PPAs (fixed, floor, cap and floor); and merchant exposure. And, tailor your negative price exposure by getting the wholesale pass through, a fixed price, or curtailing when prices are below zero - or after a number of negative hours.
-
TNUoS charges are now included for solar in co-located runs.
January 2026 release (update from October 2025)
Key changes:
– in GB, 3-6% reduction in battery revenues, driven primarily by a lower GB wind buildout reducing Balancing Mechanism opportunities.
– in Germany, there is ~1% reduction in day ahead revenues.
Market pricing model updates
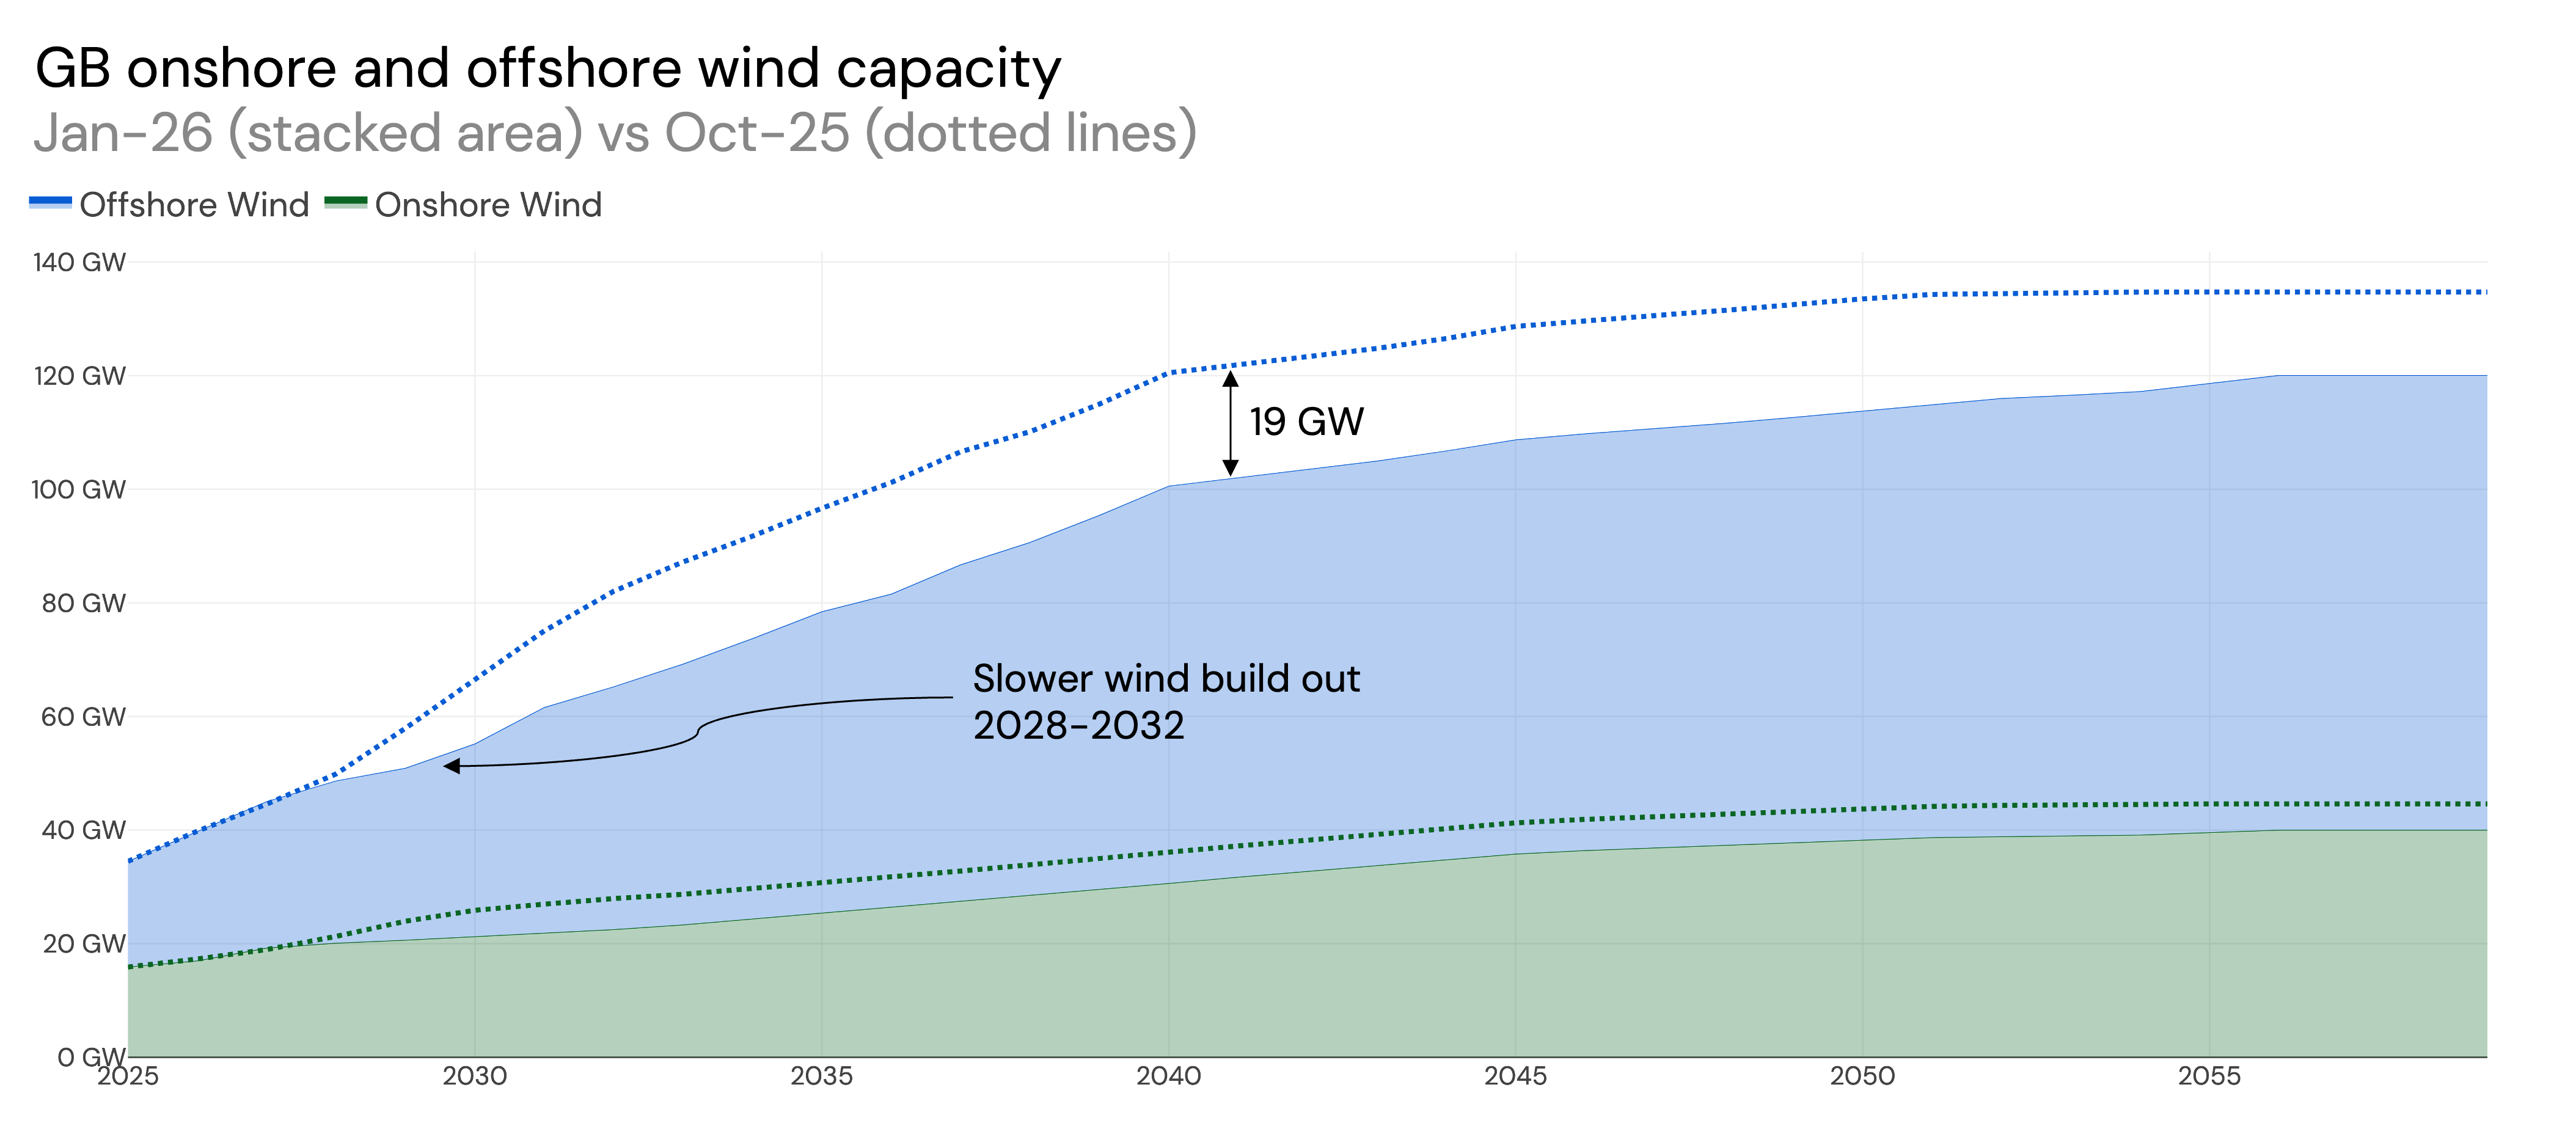
- Updated the wind buildout based on the latest Contracts for Difference auction results (AR6 and AR7). A slower build of wind, and removal of Hornsea 4, means GB now has 19 GW less offshore wind capacity in the 2040s compared to the previous forecast.
- Price impact: Power prices increase, but day-ahead spreads remain consistent as the low price continues to be set by wind generation.
- Revenue impact: Lower wind capacity reduces Balancing Mechanism volumes, leading to lower BM revenues for batteries. This particularly affects longer duration systems with higher cycling, as these assets typically derive more revenue from the BM.
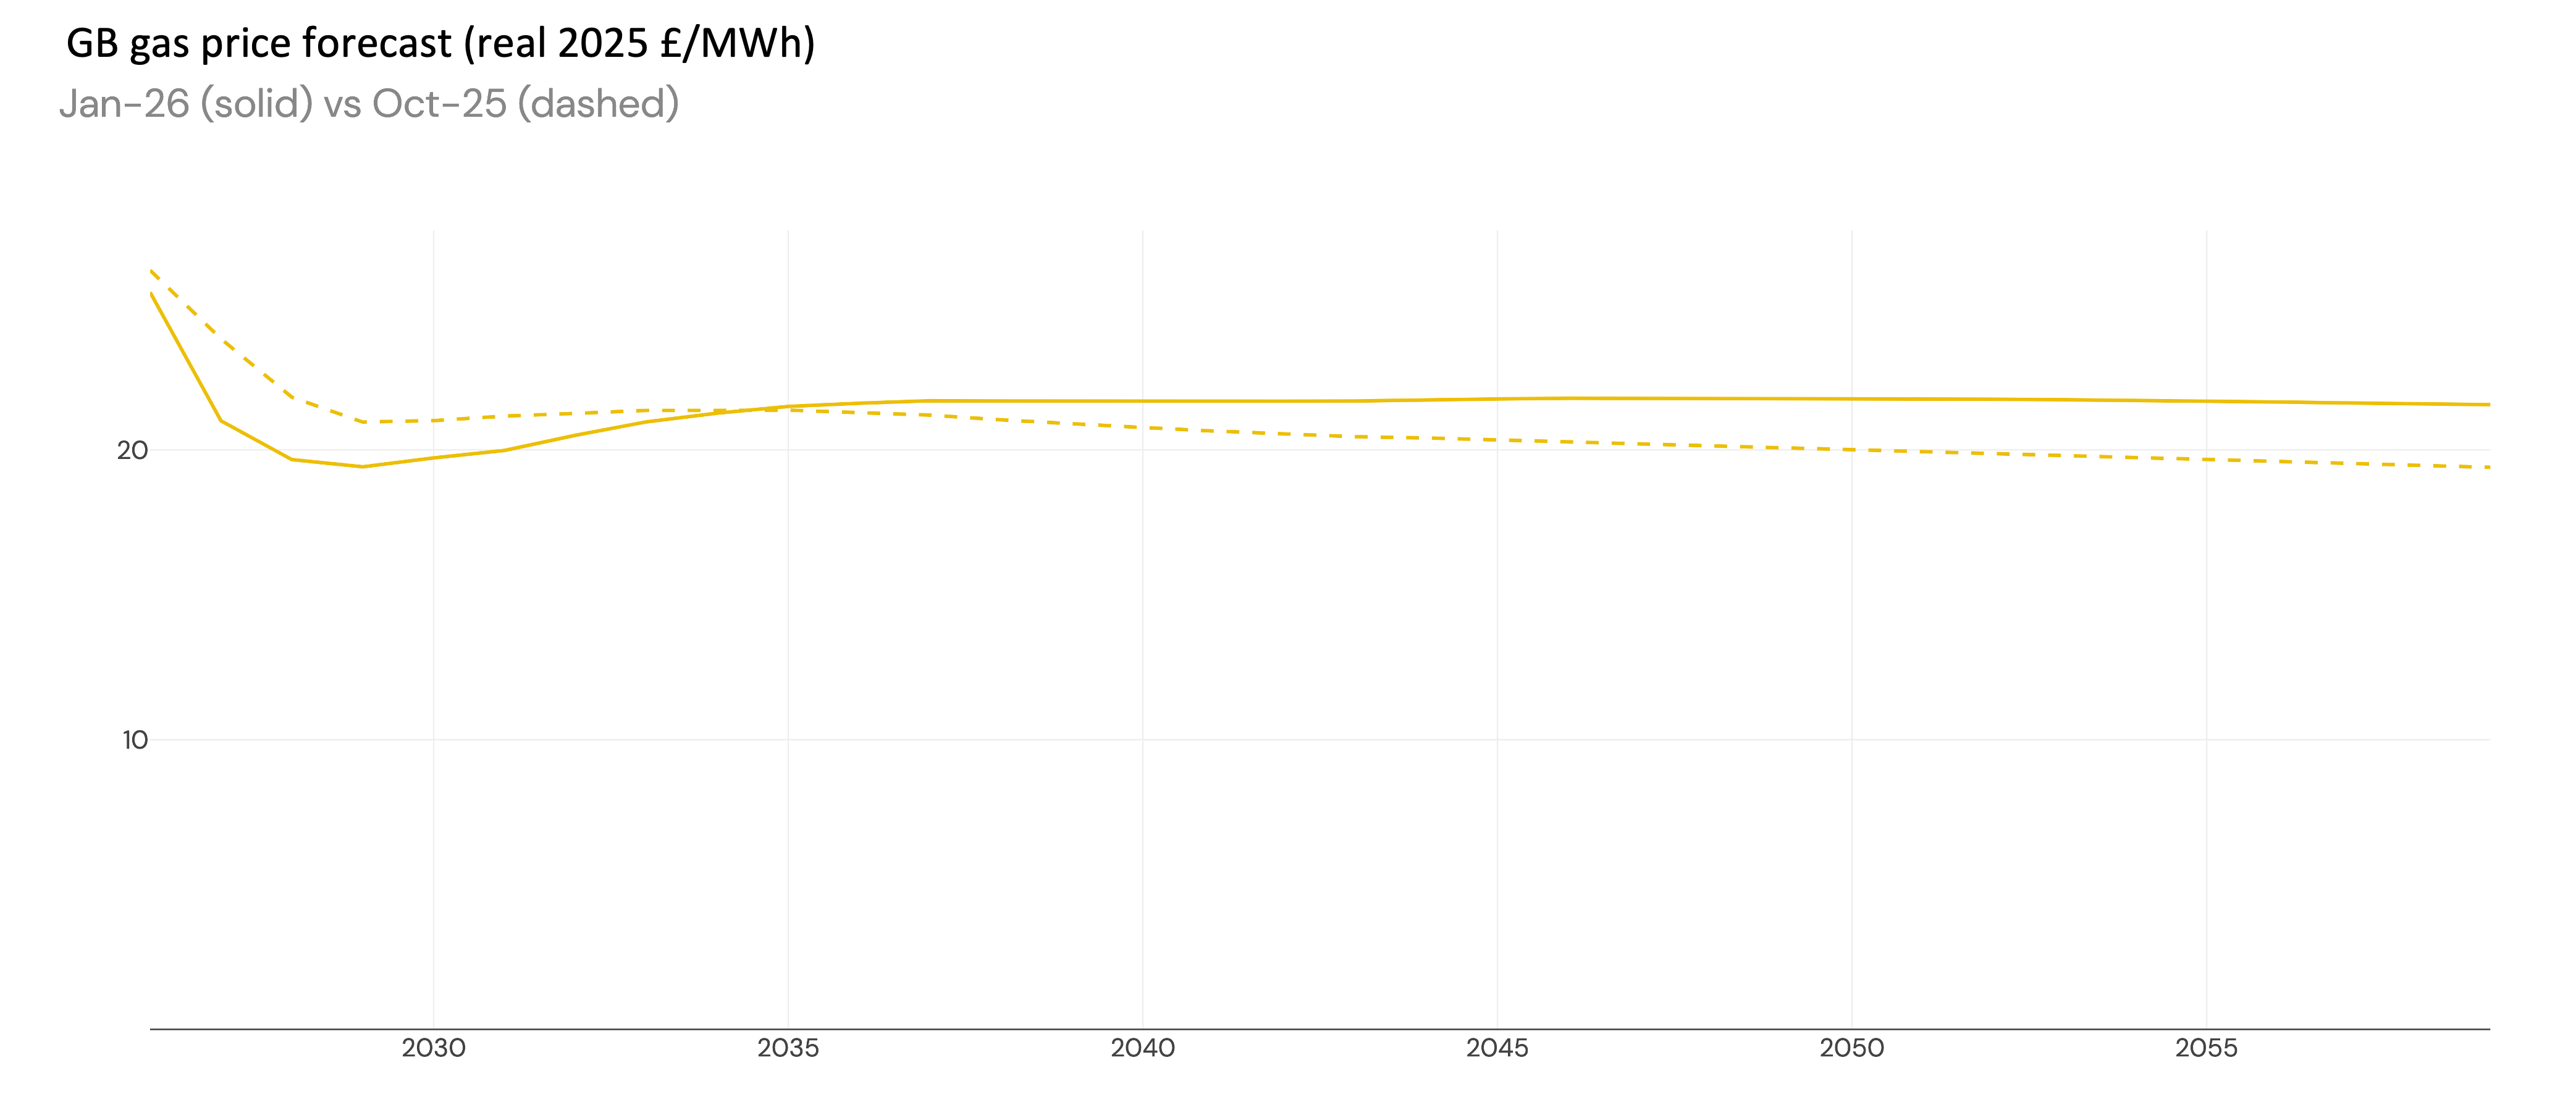
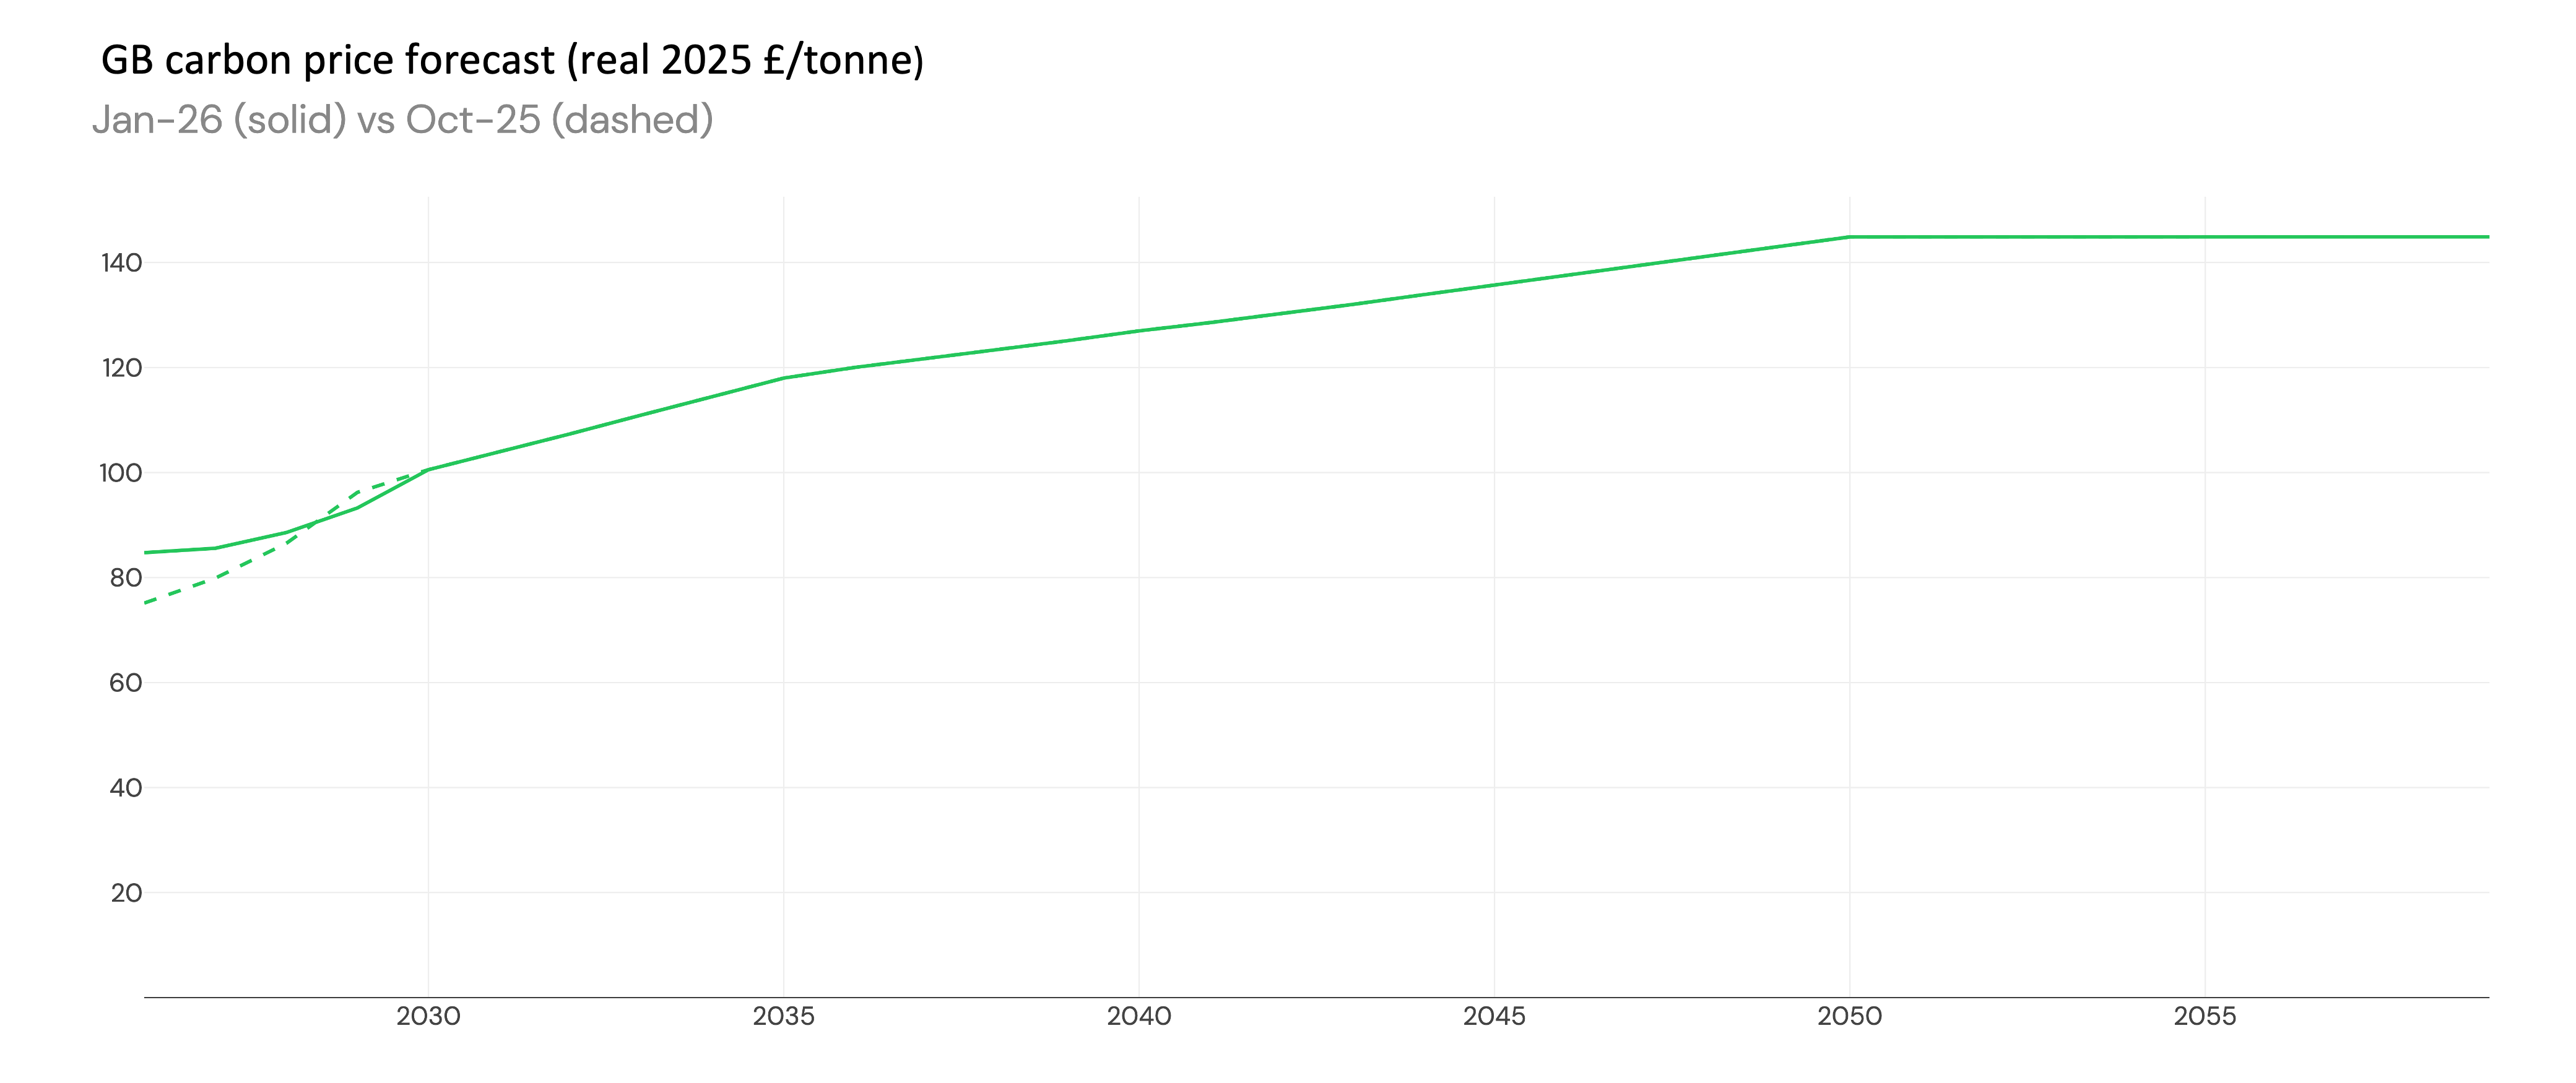
- Updated commodity prices.
- Gas: Aligning with the latest market forward curves, the front months are up and next few years are down. Longer term, the gas price is up due to updated external forecasts.
- Carbon: Aligning with the latest market forward curves, first few years are up and longer term view is the same.
-
Revised the nuclear buildout in Spain: a small amount of nuclear capacity is now expected to remain online until 2050.
-
Shorter duration batteries in Germany get augmented, so that 1h systems are repowered into longer duration systems.
Dispatch model updates
-
Updated calibration of GB assets with the latest backtest. See Model Assumptions for more info.
-
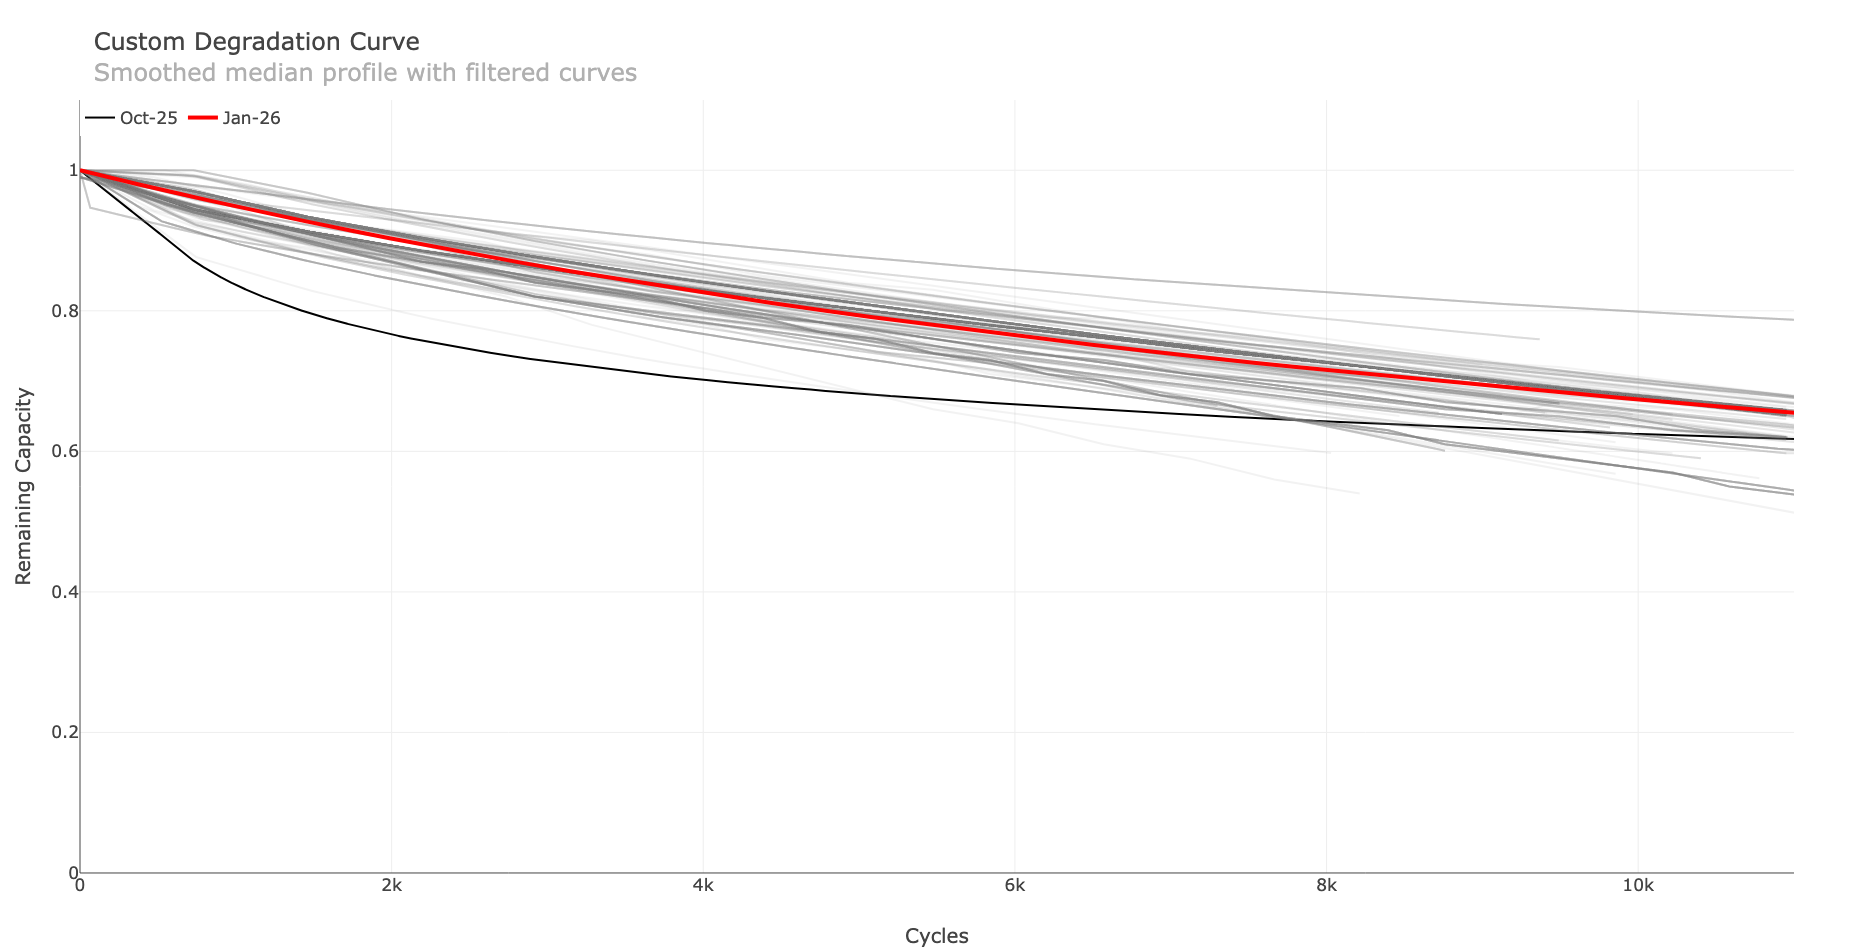
Updated the default degradation curve using recent market data. Technology improvements mean batteries degrade less than previously assumed. The repowering logic has also been updated so that timelines for battery sites repowering are more accurate. This particularly impacts constrained sites, where previously they would repower early.
New features
-
As curtailment is becoming increasingly common in connection offers, understanding its impact is critical. You can now upload custom grid curtailment profiles to the terminal, allowing batteries to optimise import and export around any curtailment constraints.
-
Solar degradation can now be applied to solar forecasts in the terminal: the default is a 0.5% reduction in solar capacity per year.
-
To capture nuances of how co-located battery and solar sites are optimised on the ground, there are now customisable operating modes within the terminal. Options include forcing solar export, exporting solar only when power prices are positive, or full flexibility to maximise total site revenue.
October 2025 release (update from v3.5)
This release includes broad changes to the model architecture. The user experience via the terminal remains the same.
-
The model has expanded from a national model of Great Britain with four simplified interconnected regions to a zonal model covering 15 regions across Europe in greater detail.
-
New inputs are now used from various EU-wide sources and individual country data.
-
An improved Capacity Expansion Model covers Europe, incorporating current policy decisions across all 15 regions while letting project economics determine the rest.
-
The forward curve has been extended to 2060 (from 2050).
-
Improved handling of fleet storage better manages price-setting behaviours as storage fleets grow. Prosumer batteries are now explicitly modelled.
-
The model now runs at 15-minute granularity (previously 30-minute in v3.5), aligning with European markets. In GB, results are rolled to 30-minute granularity to match the settlement window.
-
Revenue forecasts are now available for Germany and Spain in addition to Great Britain, covering all expected revenue streams for battery energy storage in these regions.
-
A new documentation site provides transparency across all forecast regions. The previous version of the documentation remains available here.
Previous updates to the GB forecast
See the previous Changelog here.