The BM is a big part of future battery revenues. Here, we go into the detail of our model of battery revenues from the Balancing Mechanism.Navigate to key topics below:
Transmission Constraints
How network constraints are becoming more severe and highly locational in GB
Bid-Offer Prices
Modelling accepted bid-offer pricing using the fundamentals supply stack
Battery Revenues
Multi-step process for modelling battery revenues in the BM
Balancing Volumes
System and energy actions for balancing the grid
The Modo Forecast includes revenues from the Balancing Mechanism, which differ by region
Tip: Wondering what the Balancing Mechanism is? Check out The Energy Academy
We model a single price for bids and offers across GB. However, BESS revenues depend on the specific location of the site. That’s because the amount of energy that we expect the ESO control room to need from an asset to balance the system often depends on where it is, and so how often it gets called on.
Forecasts of bid and offer prices are available in our Power Price package, and BESS revenues in the BM are available in the BESS revenue package.
The Review of Electricity Market Arrangements (REMA), Connections Reform, Clean Power 2030 (CP30), and the Strategic Spatial Energy Plan (SSEP) are upcoming policy reforms.
All, in various ways, are trying to address significant and growing constraints in the GB power market due to limited transmission infrastructure and inefficiencies in the current market, as well as enabling the transition to net zero and away from reliance on Russian gas.
Here, we describe how transmission constraints are handled in the GB battery revenue forecast. It is based on current market structures in the Balancing Mechanism.
Network constraints are becoming more severe and highly locational
Many TWh of new-build generation will come online over the next 25 years and with that, a build-out of HV wires in the transmission network to carry the power generated.
Despite planned upgrades to the transmission system, there will be a limited amount of copper cable to transport power from where it is generated to where it is used. Most of the huge wind buildout is (and will be) in the North of Great Britain, whereas demand is concentrated in the South.
Flexible plants will be required to balance out supply and demand on each side of each major boundary.
Modelling the future network
Upgrades to the transmission system to support this growth in supply and demand are based on data from the Electricity Ten Year Statement. It provides anticipated constraint levels across each boundary in future years to answer “how much of the time will boundary be constrained”?
We use the “Leading the Way” (LW) scenario from ETYS, which provides transmission capability forecasts and power flow percentiles for each boundary out to 2043. Beyond 2043, we assume capability remains flat at 2043 levels.
For scenario analysis (High/Low), we can scale the year-on-year transmission capability improvements up or down relative to the ETYS baseline.
The capacity of flexible technologies (ie thermal plants and energy storage) to respond to imbalances across each boundary is taken from the techno-economic capacity build-out with the forecast. This is then split by region according to DUKES (which describes transmission-connected assets) and the Regional Future Energy Scenarios (for those connected at the distribution level).
We model volumes of energy that need to be balanced, both for system reasons (e.g., constraints) and for energy reasons (e.g., differences in supply and demand) out to 2050.
GB transmission constraints: 2024 to 2033 and beyond
Anticipated transmission constraints are shown below, with commentary on what drives them.
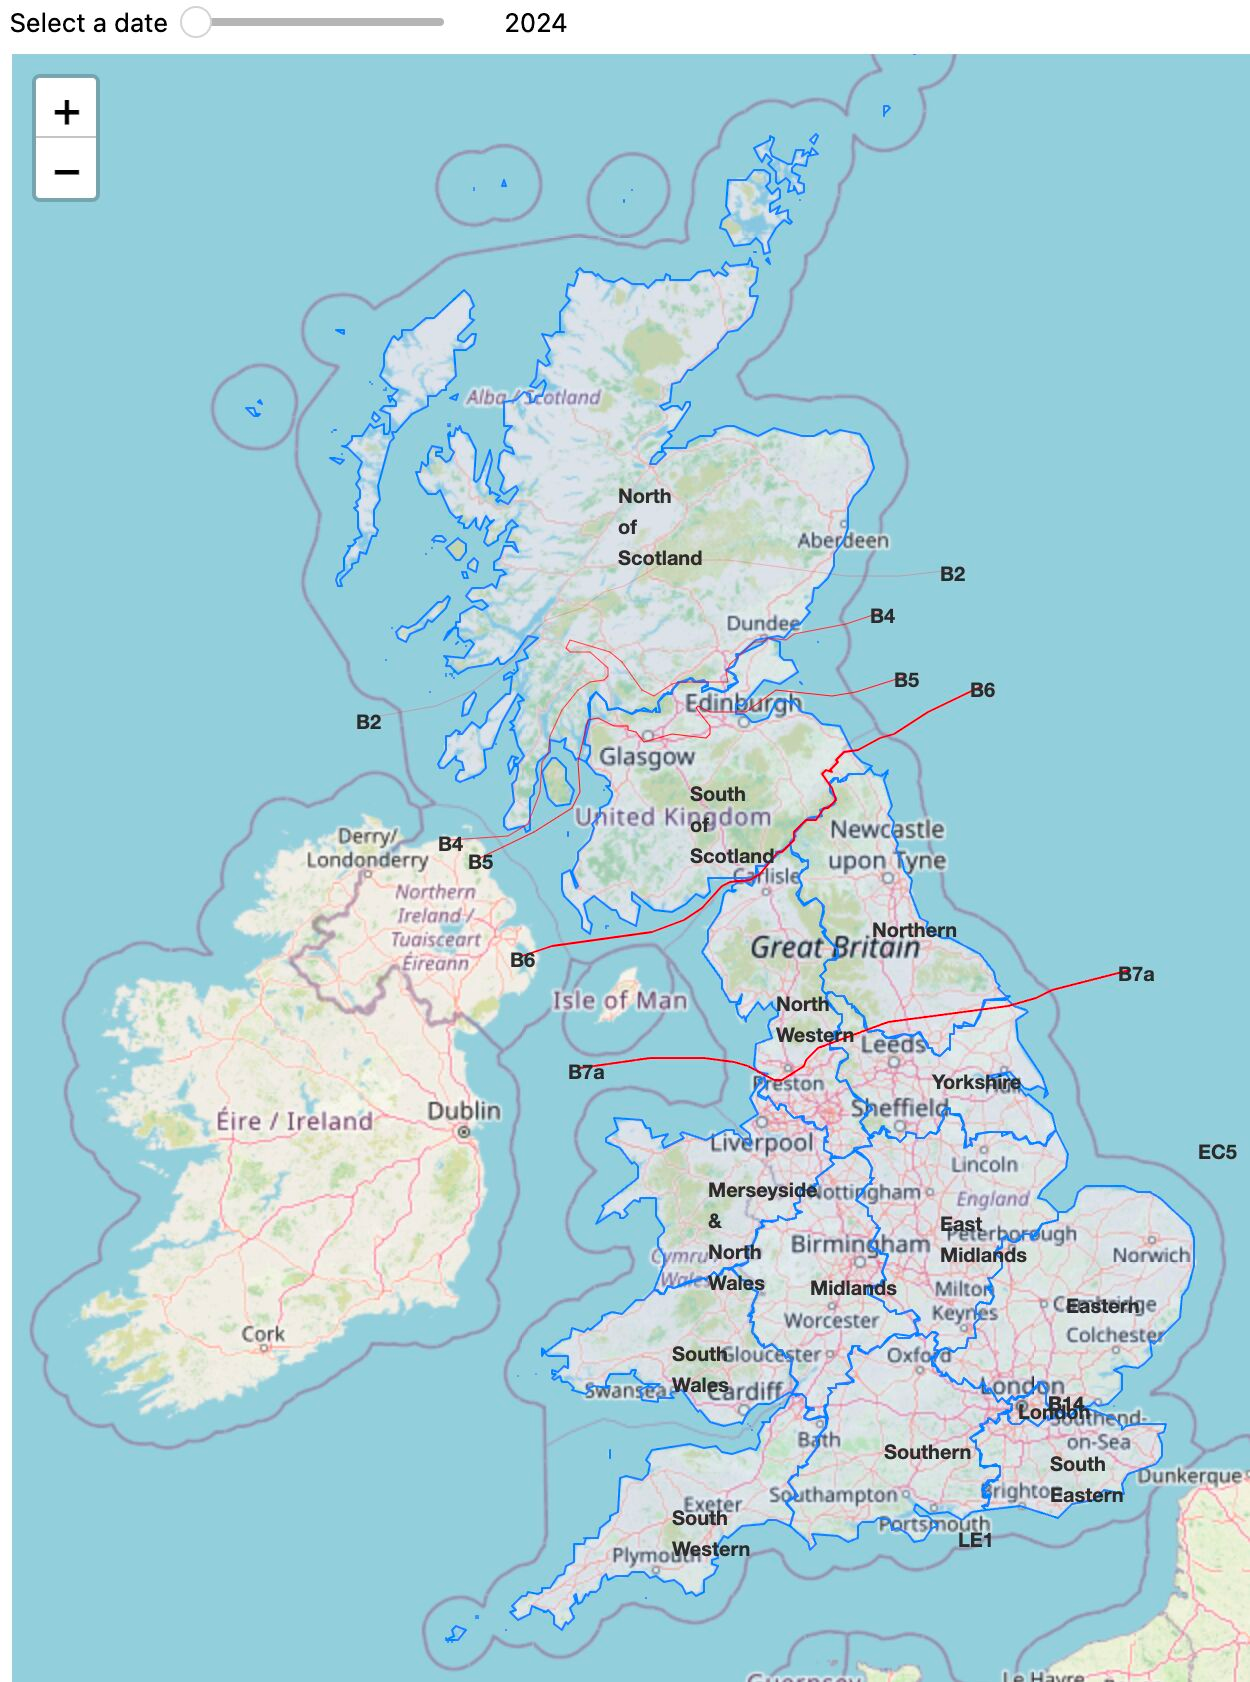
High levels of wind generation in Scotland need to move across the border towards demand centres in England. In 2024, the largest constraint in Great Britain was the B6 constraint with similar levels on the B7a. Both boundaries can be simultaneously resolved with bids North of the B6 and offers South of the B7a.
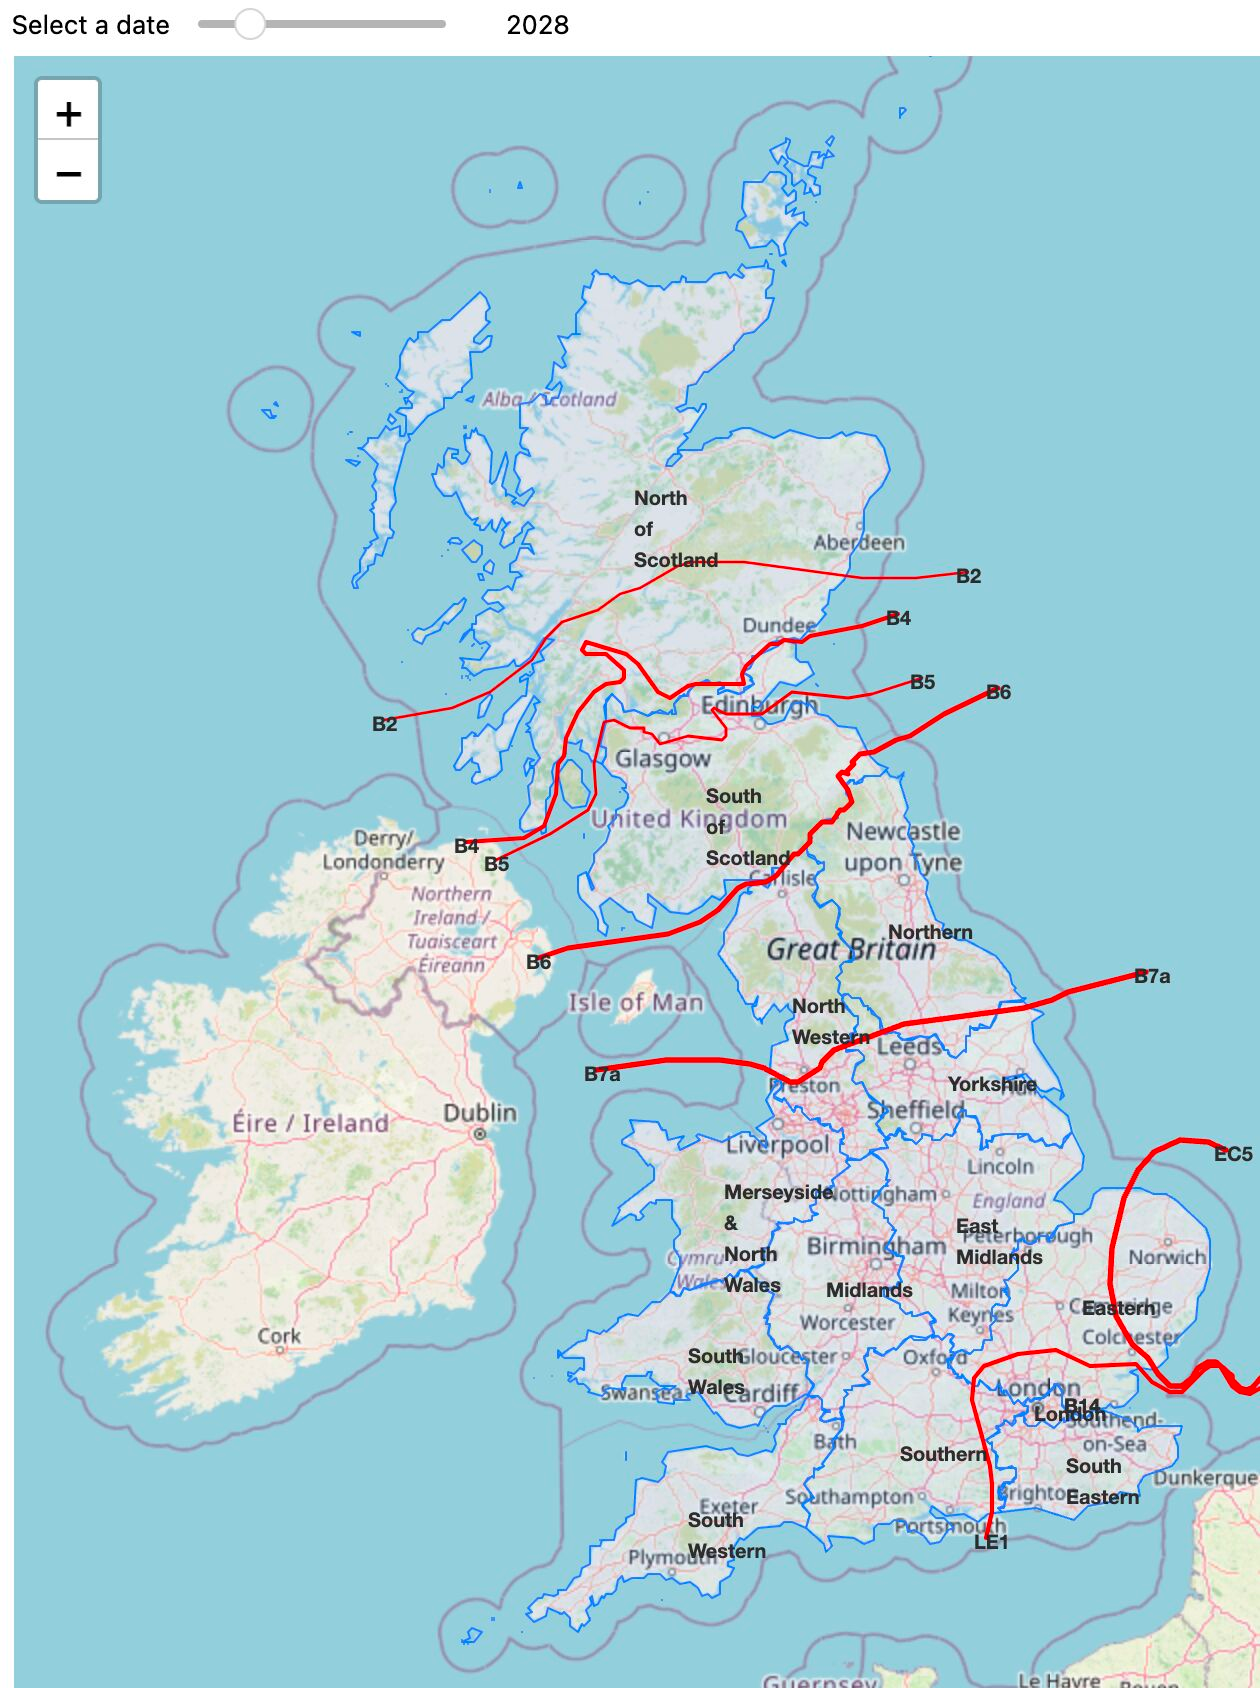
By 2028, there will be more constraints in Scotland as well as in the East of England (due to wind generation) and the South East of England (due to interconnectors and high levels of demand). There will then be considerable constraints further North in Scotland than the B6 which bids north of the B2 boundary would ease.
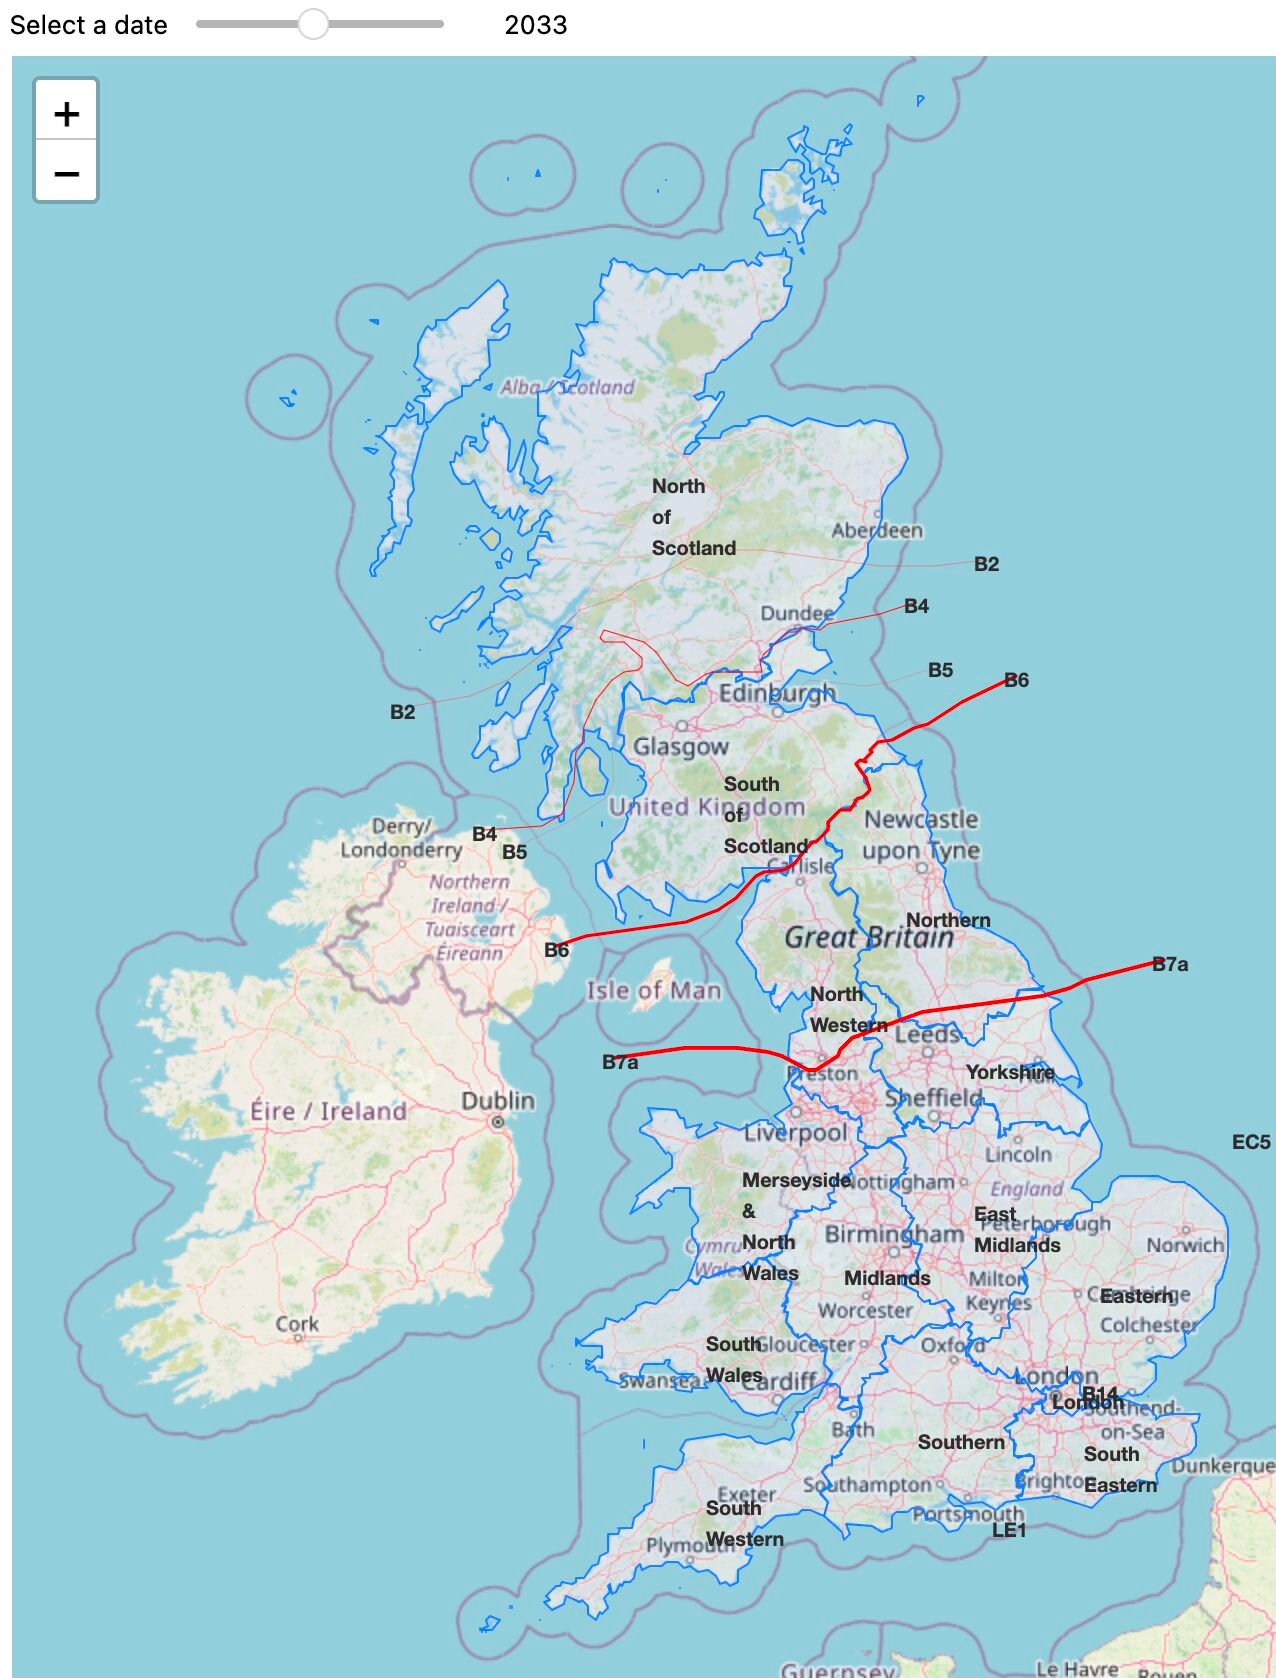
By 2033, transmission improvements will mean the situation returns to a similar situation to today, with the B6 once again being the dominant constraint.
We have made adjustments to the Electricity Ten Year Statement data in later years as it would otherwise lead to unrealistically high constraints in Scotland, particularly at the B2 boundary. In reality, the cost of building more transmission in the area would be cheaper than the cost of balancing the system, so we have increased the assumed level of transmission capability in Northern Scotland.
In the constraint modelling, do you assume any future outages on the transmission network?
The actual performance of the boundaries we model is not 100%.
While we don’t explicitly model outages, we account for them implicitly by using historic data to calibrate the model.
The Electricity Ten Year Statement is used to work out what flows we expect across each boundary for every half-hour period. This is compared with the theoretical capability of each boundary to calculate how constrained the boundary will be.
Constraint Level to System Volume Mapping
A mapping converts constraint levels (power flow ÷ transmission capability) to the BM system volumes needed to address them. This mapping is based on historical analysis of BM volumes, comparing B6 transmission capacity against net BM volumes transferred across the B7a boundary.
Minor constraint levels (below ~30%) don’t trigger significant BM actions. Above this threshold, system volumes increase non-linearly with constraint severity.
The B6 is not always operating at full capability, so this model implicitly accounts for outages.
In doing this, we assume:
- Outages on all boundaries are similar to what the B6 has had over the last couple of years
- The relationship between the constraint level of a boundary and the BM volumes needed to address it is the same for each boundary
This might not be the case, but the fact the B6 is currently the only significant constraint makes it impossible to do anything different.
Modelling bid-offer prices
Modelling accepted Bid Offer pricing using the fundamentals supply stack
We vary demand and rerun our fundamental price model to get a bid and an offer price per half-hour period. These represent the volume-weighted average accepted bid and offer prices for each settlement period, and are the same across GB, regardless of region.
The reason we assume the same price across GB is due to the Transmission Constraint Licence Condition (TCLC). This states that bid and offer pricing cannot be adjusted to take advantage of being behind a constraint.
We also assume a minimum spread between the offer and bid price (£50/MWh), which is informed by historical data.
An example week from August 2030 is shown below.
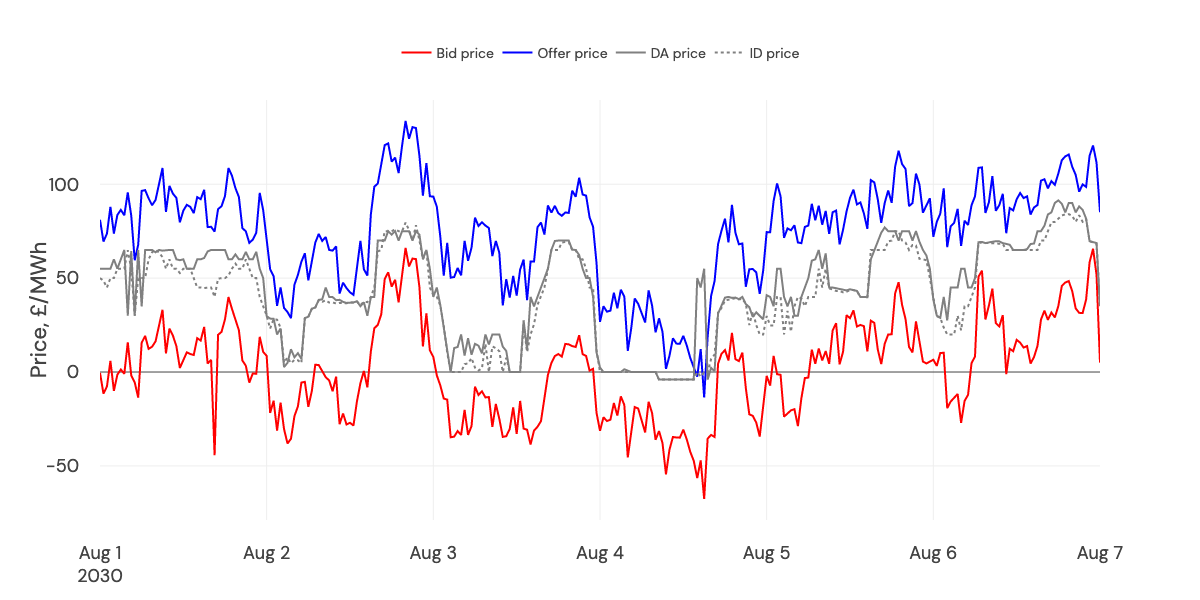
1 week of bid & offer prices taken from v3.4 of the GB Power Price forecast.
Battery revenues in the Balancing Mechanism
Battery BM revenues depend on several interconnected factors. Explore each component below:
Balancing Volumes
System and energy actions for grid balancing
Dispatch Rates
How battery dispatch rates are evolving
Battery Optimisation
Linear programme optimisation in the BM
Modelling battery revenues in the BM is a multi-step process
We assume national bid-offer pricing, which is modelled by flexing demand up and down with the intraday supply stack, and setting a minimum spread.
Once we have the price, estimating the balancing actions for batteries can be split into the following steps:
More information on each of these steps is included in various subpages, linked below or explore the panel on the left.
1. What’s the size of the market, now and in future?
First, we model the volume of balancing actions that will be required for both system-flagged (i.e. constraint) reasons and for energy-balancing reasons.
The links provide more information on modelling balancing volumes and assessing the flexible competition.
2. What are expected dispatch rates for system and energy actions, and how will batteries compete in these markets?
More information on dispatch rates of traditional and battery technology is provided in the Dispatch rates of batteries section below.
3. And finally, how might a battery actually operate in the BM and generate revenue?
We create a dispatch profile of how a single ‘optimal’ battery in a certain location (with a defined number of cycles and energy storage capacity, etc) would behave. Trades are also required in the intraday markets to rebalance state of charge.
More information on how we optimise batteries within the BM is provided in the Modelling battery optimisation within the BM section below.
Modelling balancing volumes
We distinguish balancing volumes into system and energy actions.
System actions
We estimate the volume (MWh) of actions required to resolve constraints across each major boundary, per half-hour.
The following transmission boundaries are modelled:
- Scottish boundaries (B2, B4, B5, B6, B7a): Wind-driven constraints, processed north-to-south
- EC5: Wind-driven constraints in East Anglia
- B14: Demand-driven constraints around London
- LE1: Demand and interconnector-driven constraints in the South East
The Electricity Ten Year Statement (ETYS) provides forecasts of annual power flows across different network boundaries, considering planned grid expansions. These forecasts include power flows across each boundary at different percentiles, to show how often each boundary is likely to be constrained.
The power flow forecasts are then allocated to half-hourly profiles of wind, demand and interconnector data, depending on whether the boundary is supply, or demand-driven. For example, if a half-hour period has wind generation at the 95th percentile, we assume the power flow across the boundary for that half-hour matches the 95th percentile value from the ETYS for that year.
This method ensures that half-hourly power flows align with expected future network conditions.
To get the volume required of system bids and offers
- Determine if a region is driven by supply or demand. The demand side of boundary is assumed to be the side which contains London. Supply regions are driven by high generation (i.e. wind), e.g. Scotland and East Anglia. Demand regions are driven by load and interconnectors.
- Determine the half-hourly wind, load and interconnector percentiles using the model’s granular supply stacks for each year.
- These percentiles determine the level of flow expected across each boundary (using the ETYS data). Any power flow above the boundary’s capacity is attributed to constraint volume.
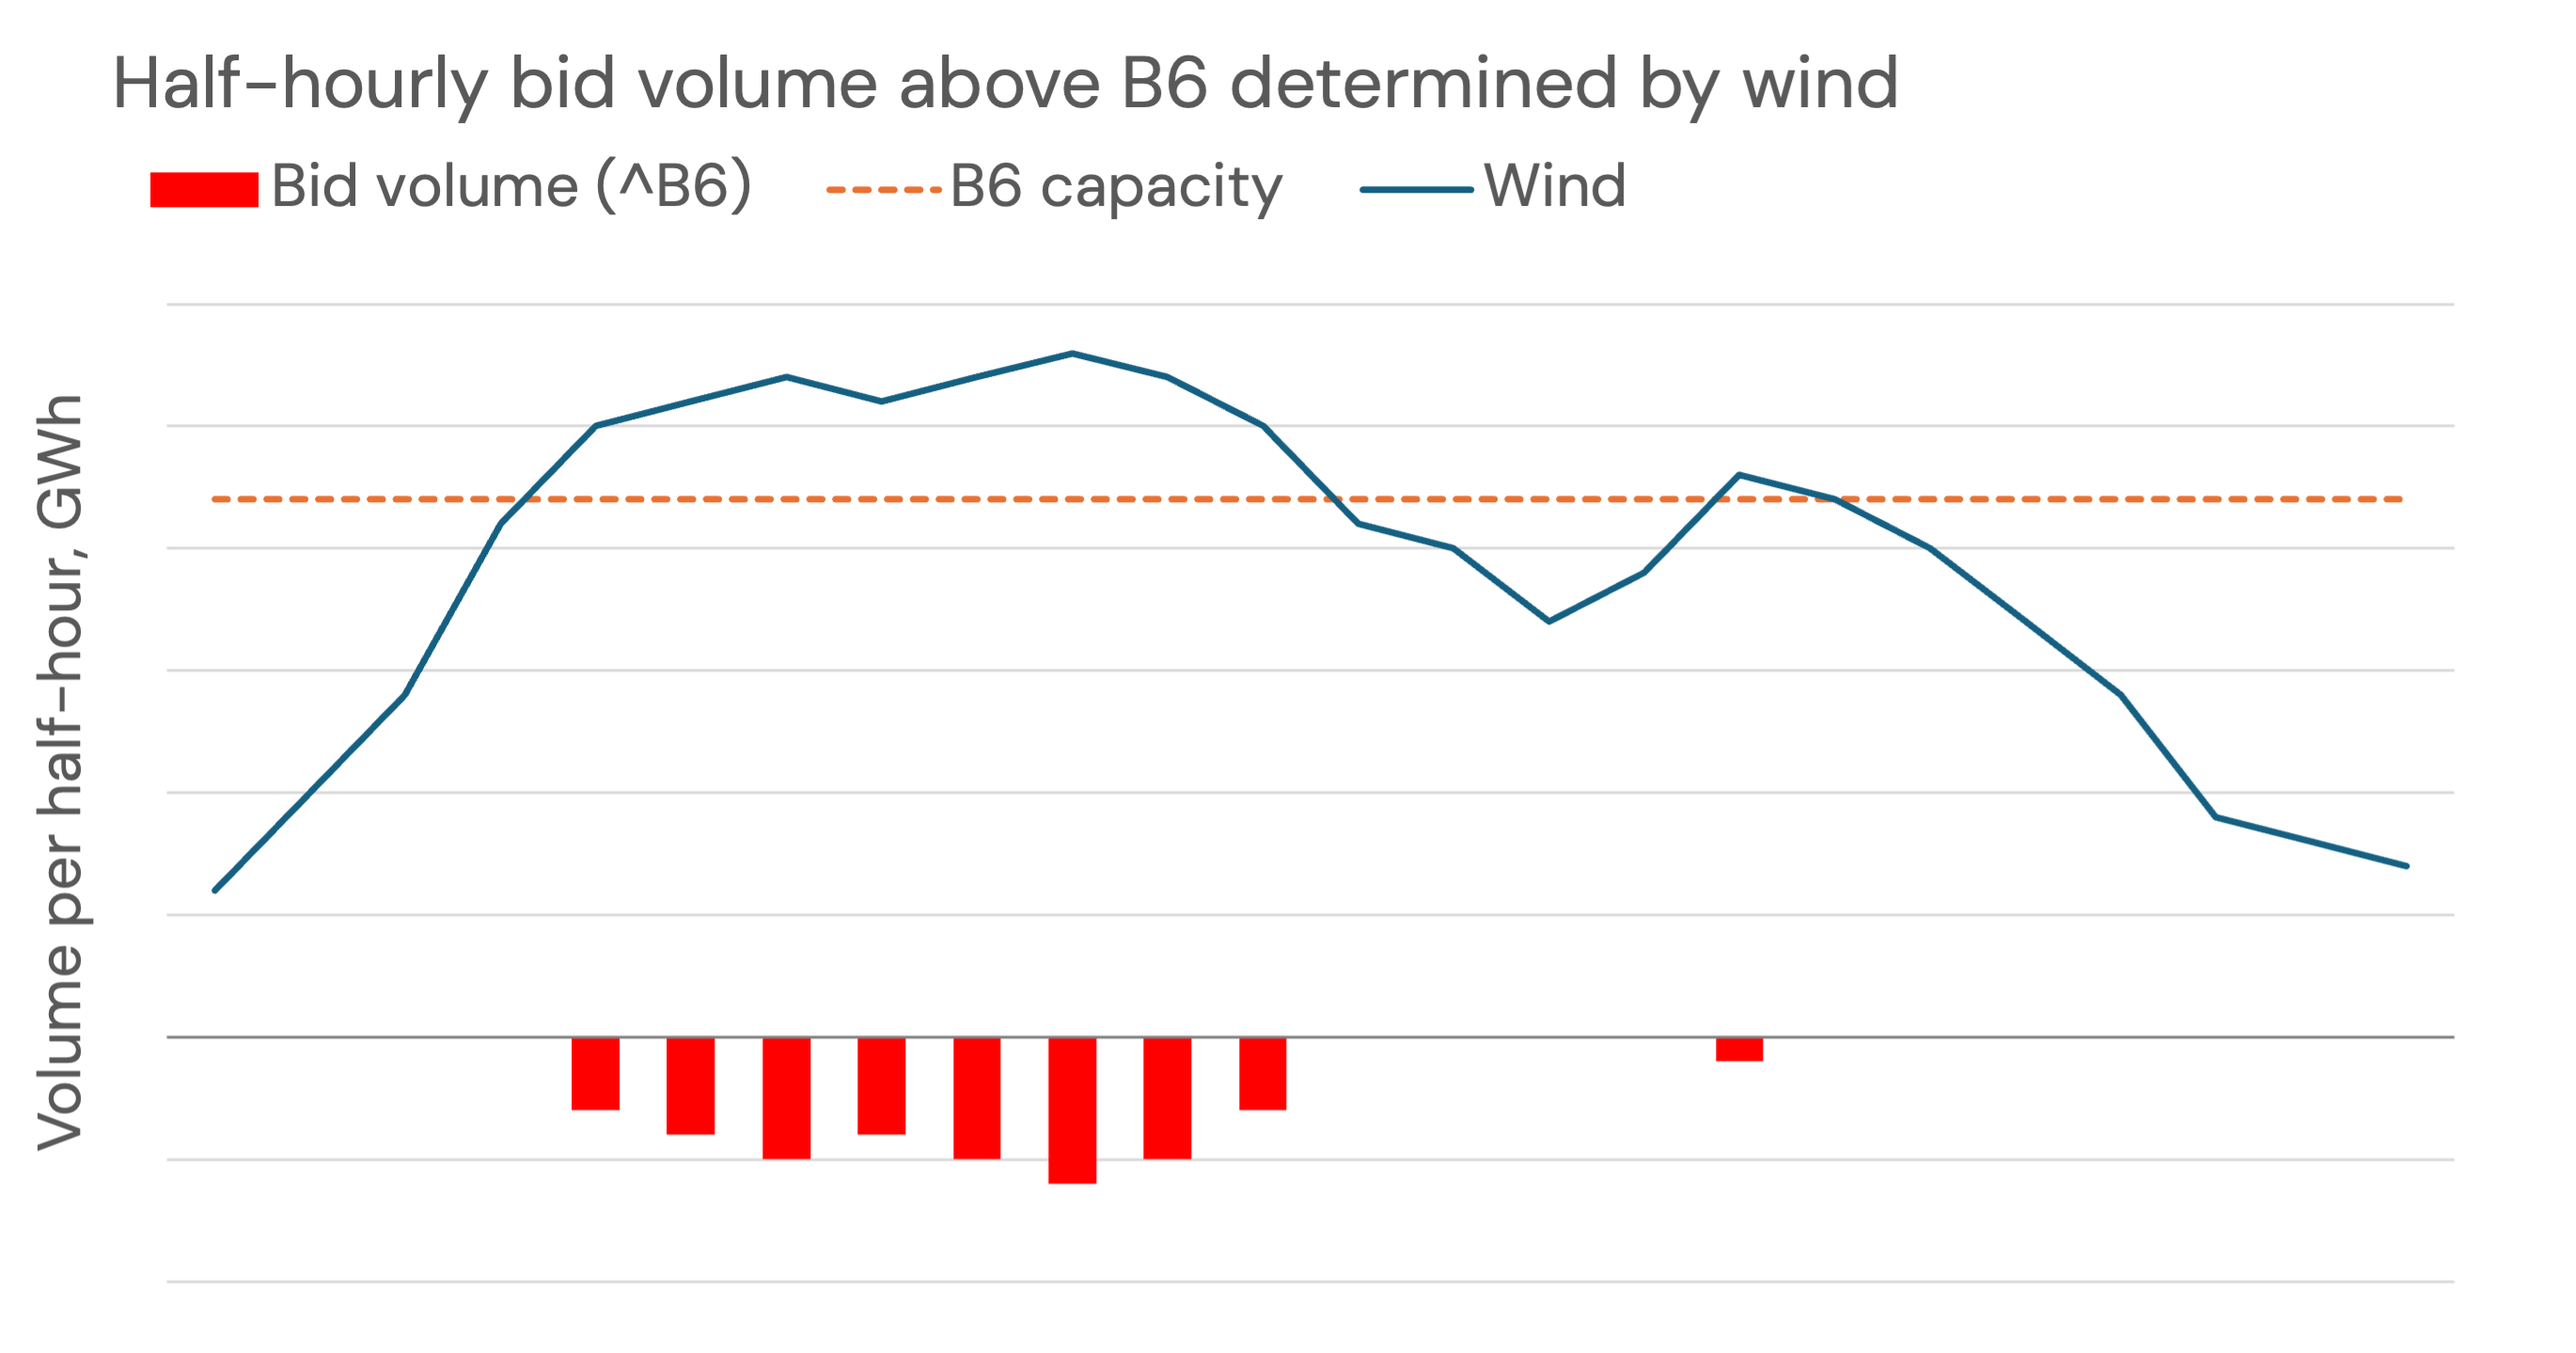
The region above the B6 boundary is supply-dominated, and so half-hourly wind generation determines the constraint volumes required. Numbers indicative only. v3.4 of GB forecast
- In addition, we resolve constraints in Scotland starting in the north and moving south (ie moving from the B2 boundary down to the B6 boundary). This means that any bids taken to resolve constraints at B2 are subtracted from the required bid volume at B4, and so on. This avoids double-counting bids.
We finally arrive at a half-hourly volume required in each region, for both bids and offers.
Energy actions
Historical data shows a linear relationship between the volume of daily wind generation and the amount of balancing volume for energy actions dispatched in the BM.
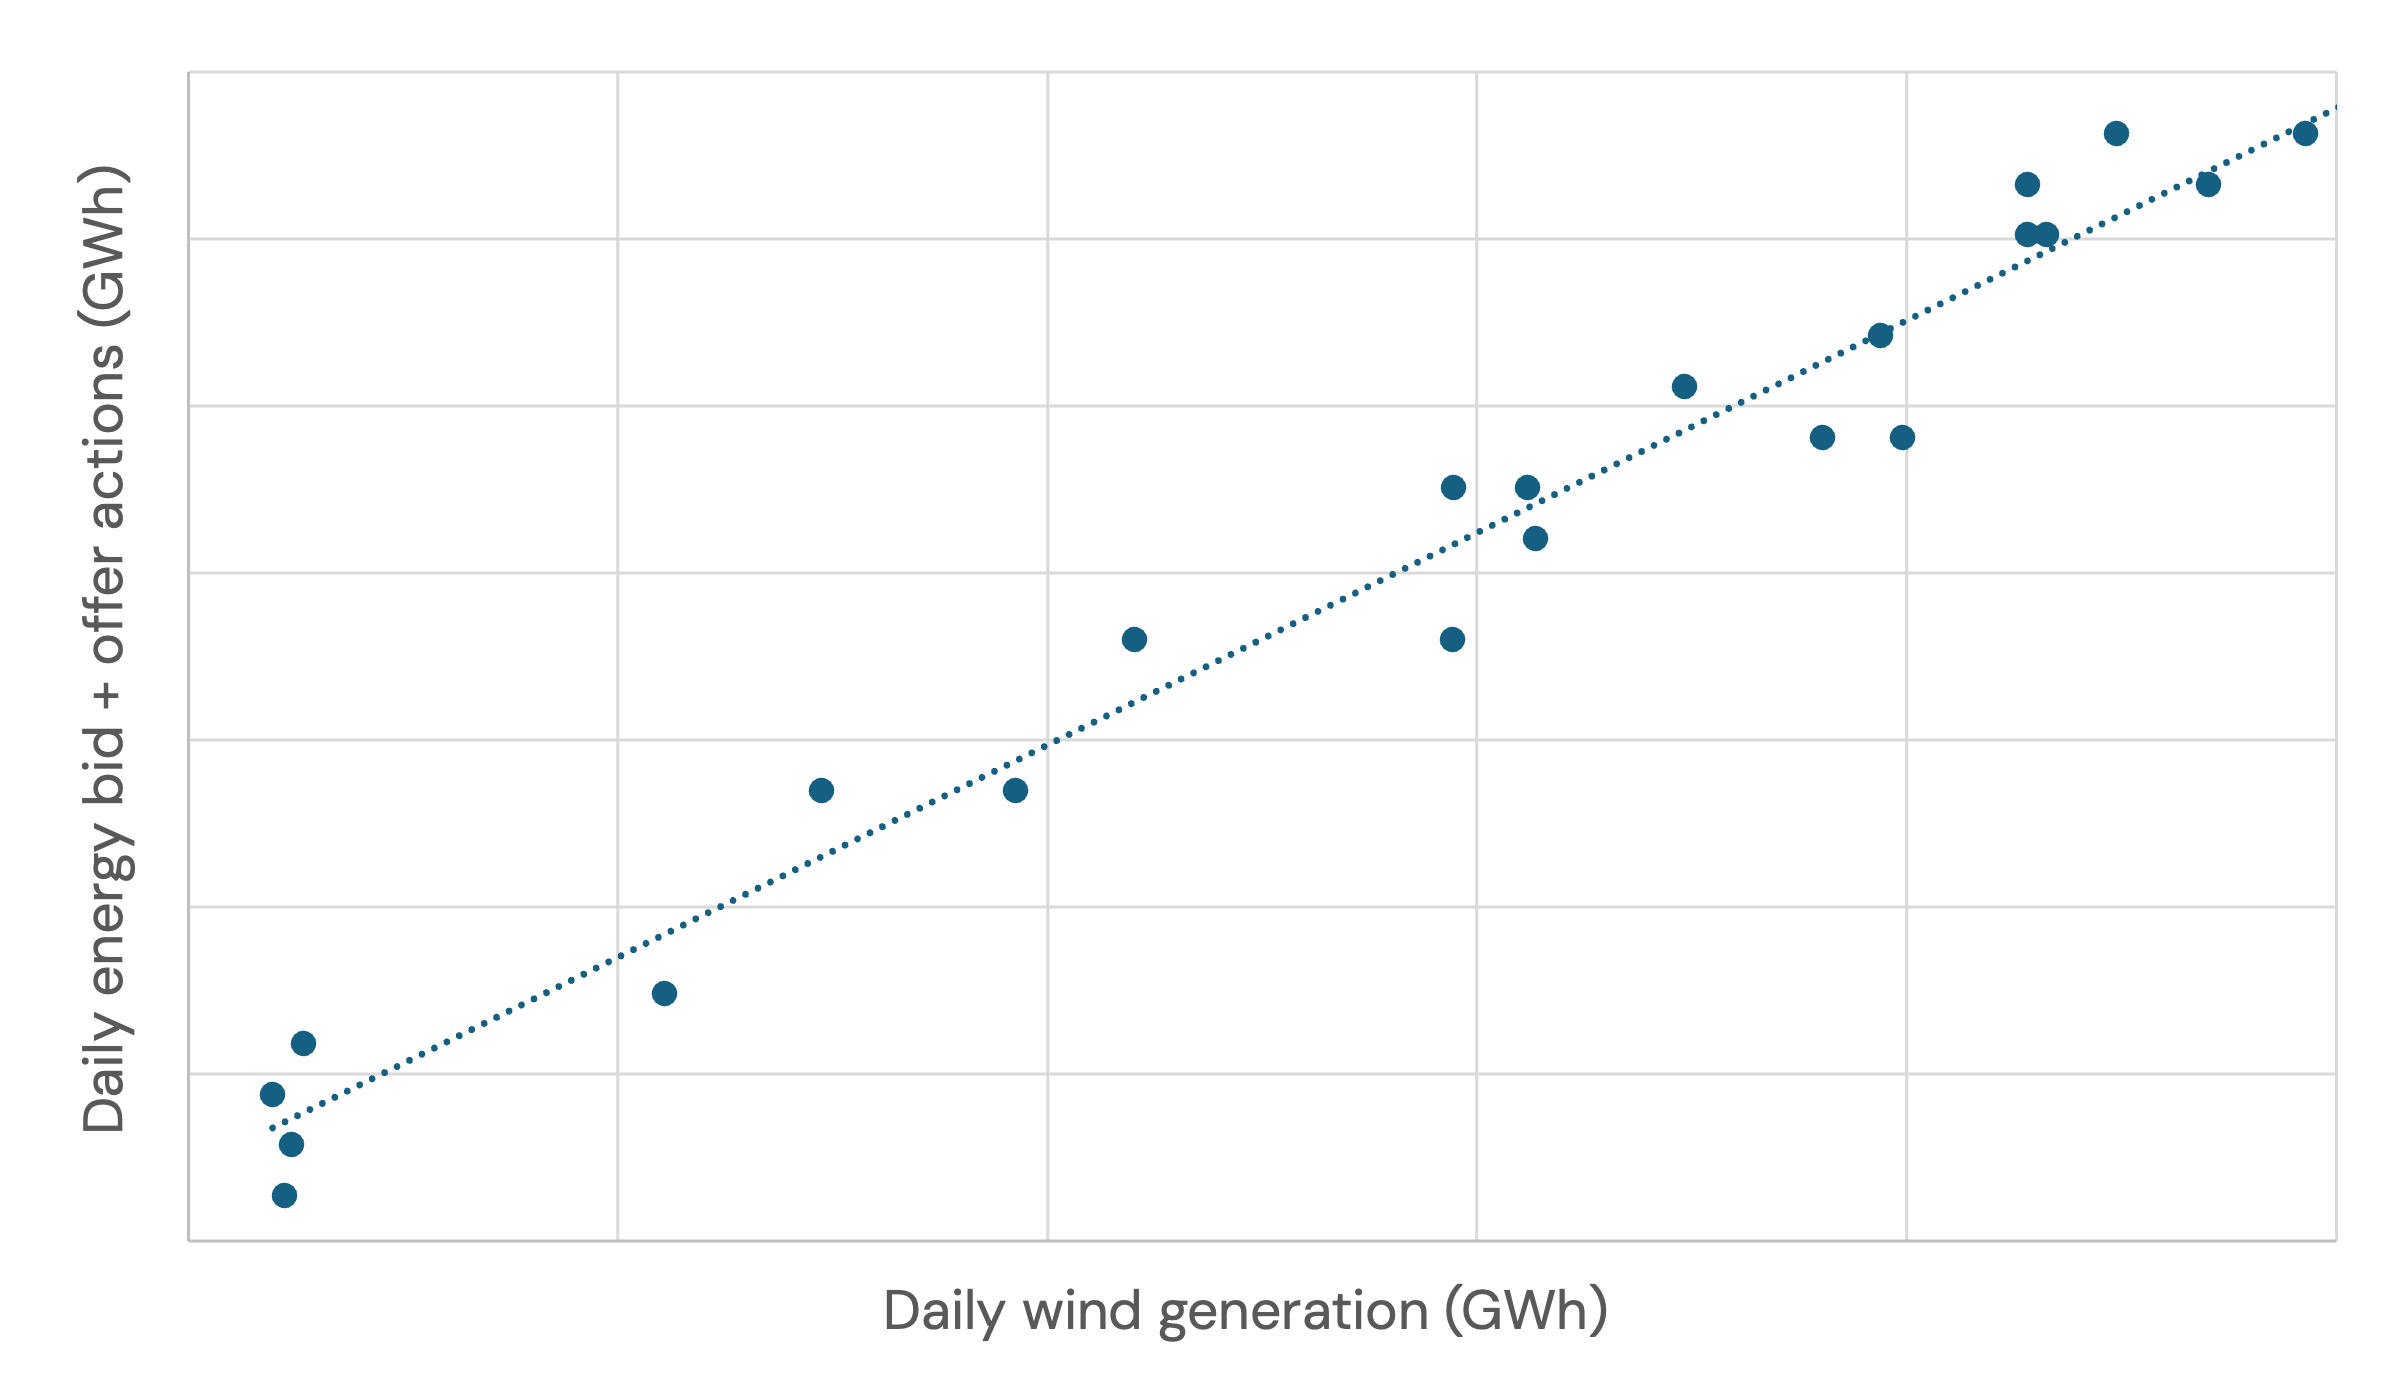
Indicative relationship between daily wind generation and daily total bid and offer volume across 2024. v3.4 of GB forecast
The relationship across 2024 is used to calculate the future daily energy volume required to balance the system (both bids and offers).
The daily energy volume is then split between bids and offers. We assume that on half of the days, the system is ‘long’ (too much generation), and on the other half, the system is ‘short’. On ‘long’ days, there are more bids turning generation down, and on ‘short’ days, there are more offers. Further, we assume 75% of bid-offer acceptances are bids (by volume) on ‘long’ days, and 25% are for offers. On ‘short’ days, 75% of BM energy volume is for offers and 25% for bids. Long and short days alternate.
To get the dispatch rates of batteries, we first estimate the dispatch rates of a generic flexible technology (like a CCGT).
We then assume that batteries will take a few years to reach a level playing field and blend today’s BESS dispatch rates with a longer-term outlook where they have technical parity within the dispatch systems in the NESO control room.
Dispatch rates of generic flexible technologies
The dispatch rate forecast is built from two components that are blended together:
-
Short-term forecast: Based on historical GSP-level dispatch rates, projected forward. We use a national dispatch rate target of ~25%, reflecting recent observed rates in constrained regions like North Scotland.
-
Long-term forecast: Based on transmission constraints and market competition. This is calculated for 9 boundary regions across GB, from Northern Scotland down to London.
System and energy dispatch rates are calculated depending on the volume required and capacity of flexible generation able to meet that volume:
- System dispatch rate for bids and for offers, in each region (MWh/MW available) = half-hourly volume of bids and offers required in each region, divided by the in-merit, available flexible generation in each region.
- Energy dispatch rate for bids and for offers, in each region ((MWh/MW available) = the average power dispatch each day for energy balancing divided by the in-merit, available flexible generation nationally.
These short-term and long-term rates are blended using Open Balancing Platform (OBP) improvement percentages, which ramp up over time as battery dispatch capabilities improve.
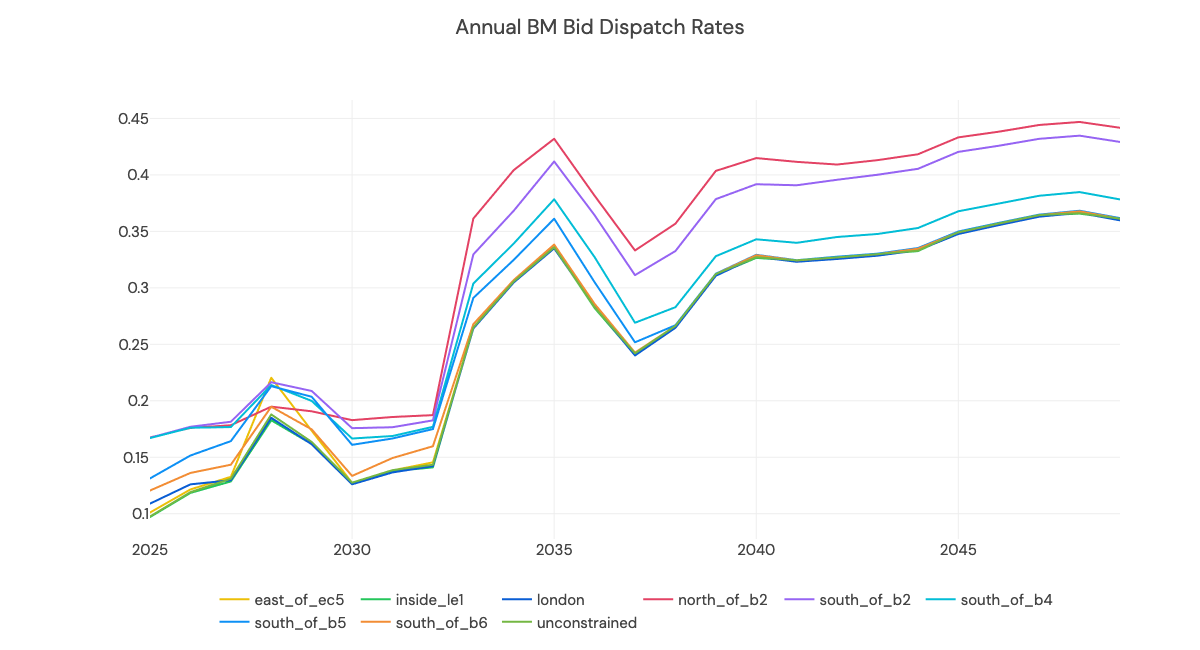
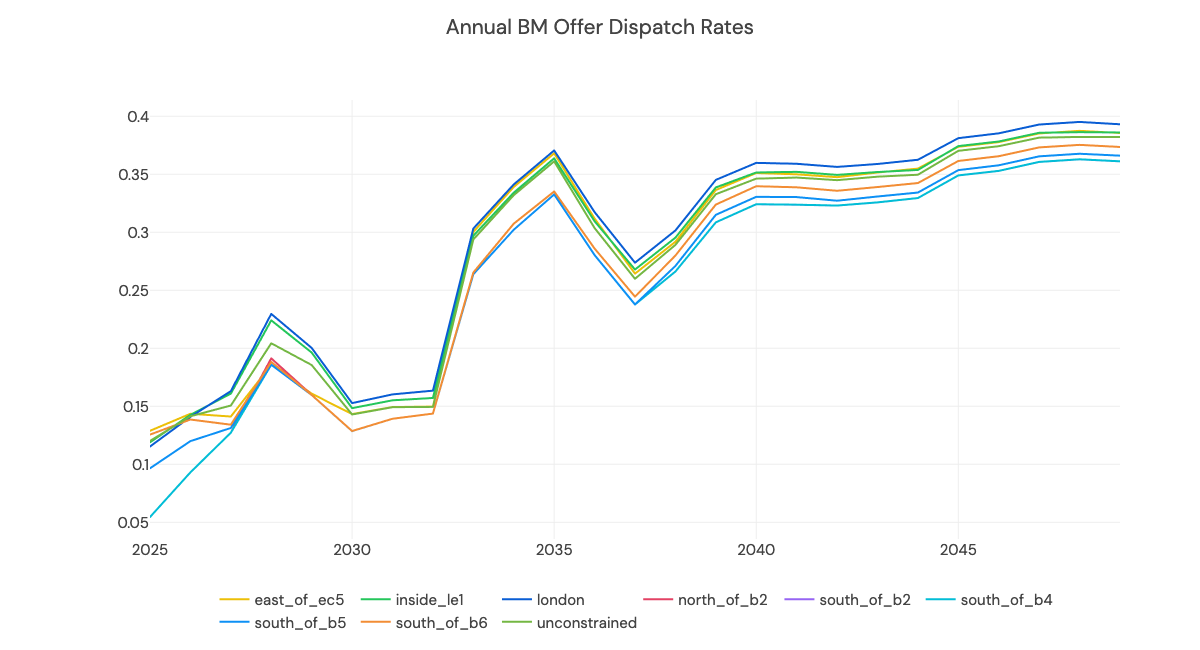
The resulting annual averages for each region are shown below. Many of the observed trends in dispatch rates of system and energy actions are similar, and explained by reinforcements to the transmission system.
For example, projected reinforcements to the B6 and B7a boundary in 2035 cause dispatch rates to 2037 to fall.
Dispatch rates of batteries
Battery dispatch rates in the BM are evolving, with observed dispatch rates doubling over the last 12 months.
This is due (in large part) to the Open Balancing Platform (OBP). Given the progress of OBP, Modo estimates the improvement in energy and system dispatch rates for batteries to 2027. The rate of batteries doing system actions increases later, once (simpler) energy actions are prioritized through tools like bulk dispatch within OBP.
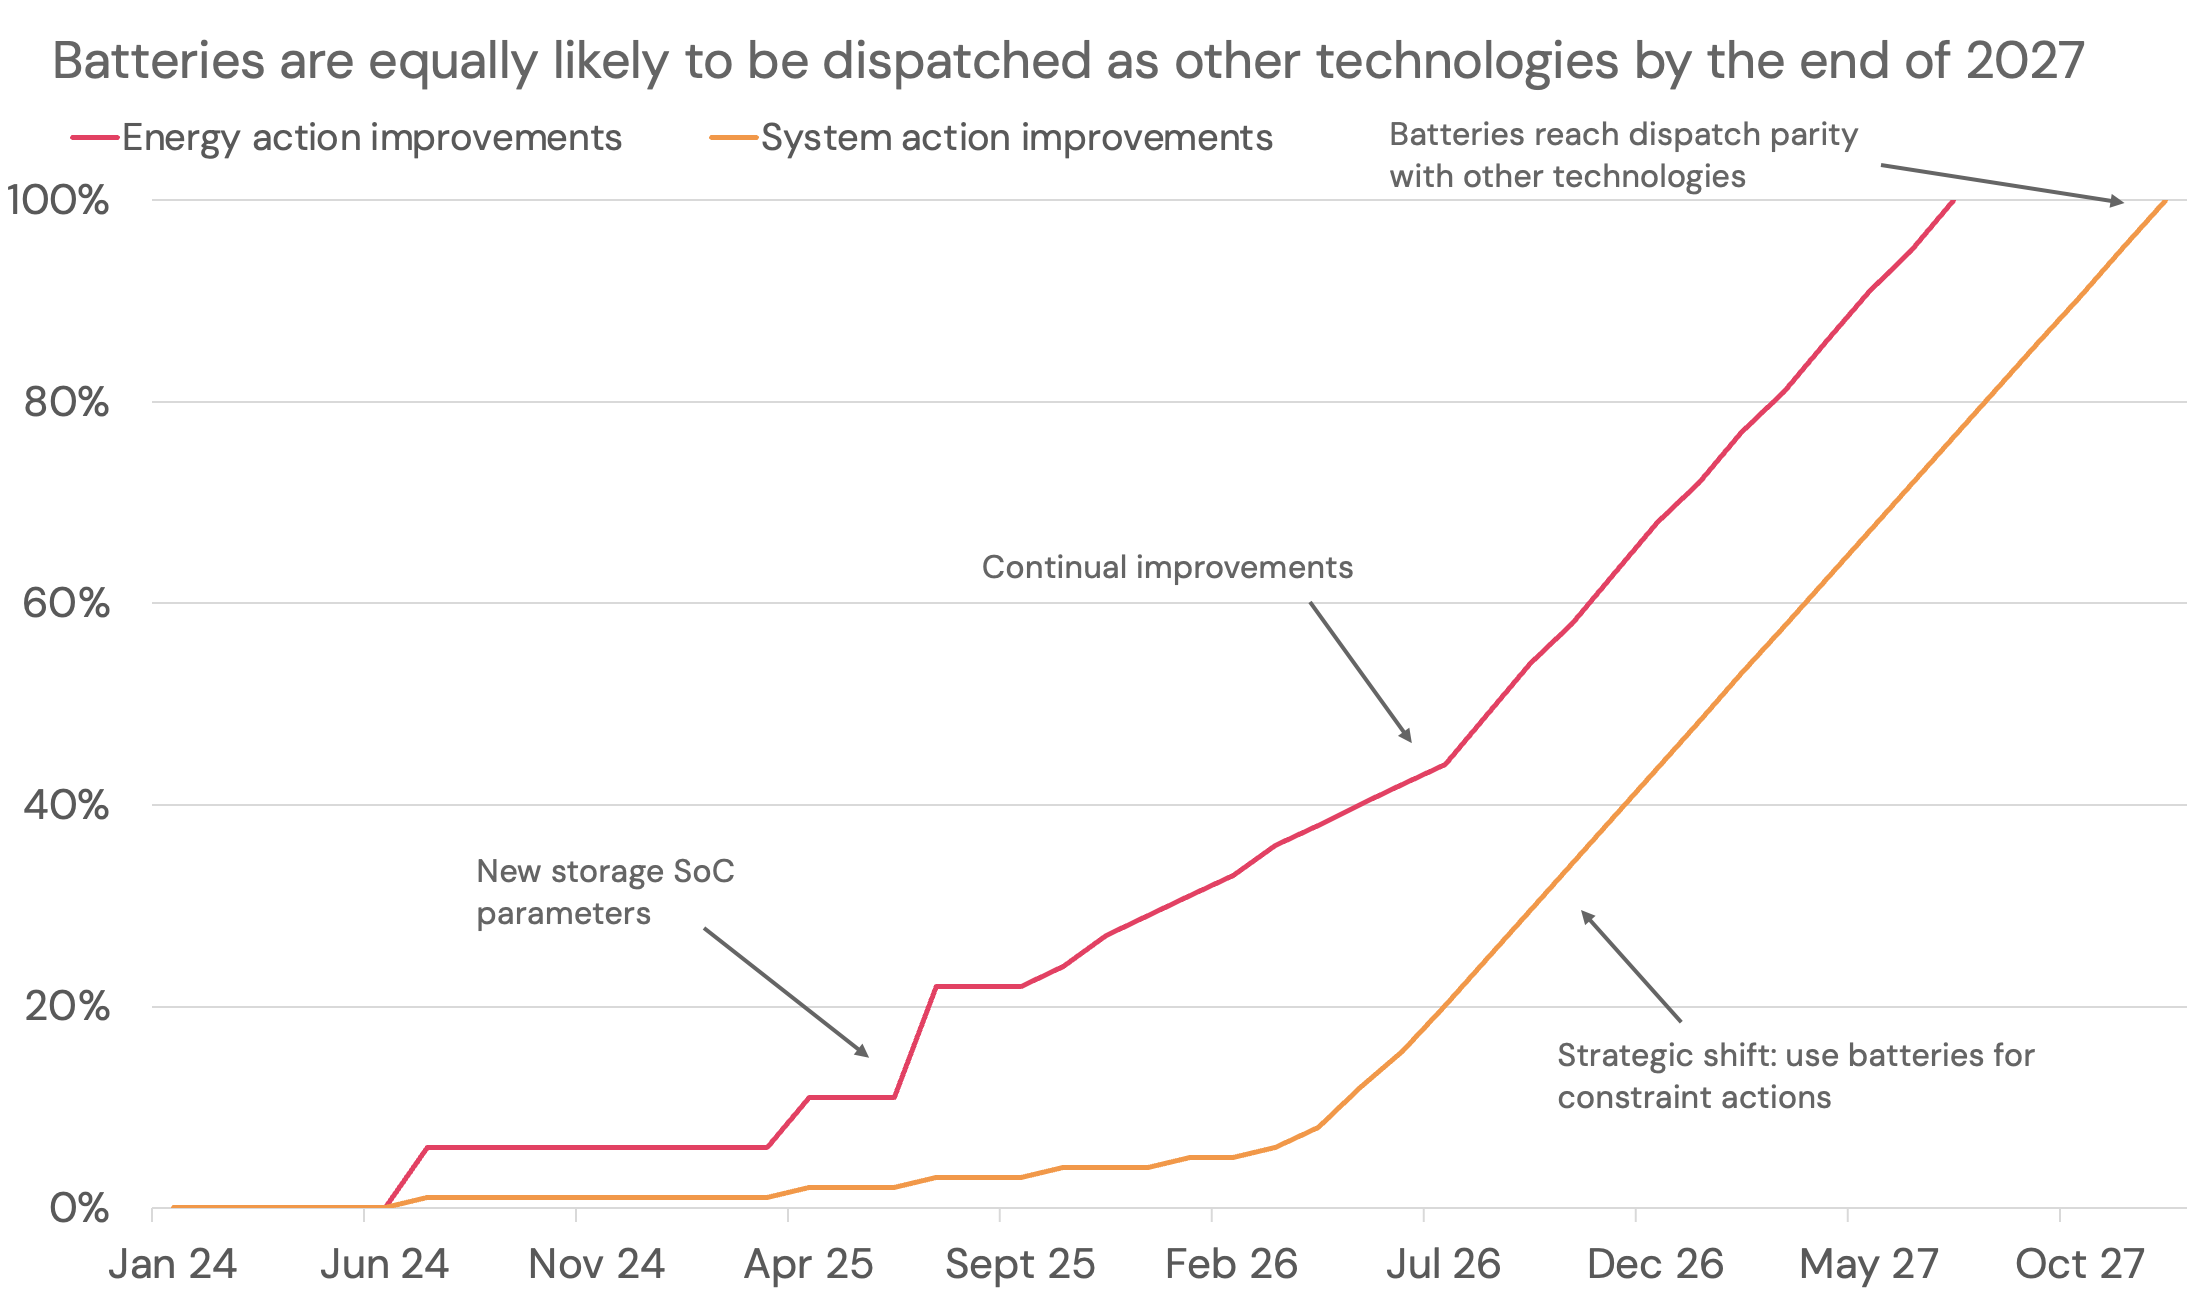
Here, 100% means that the control room treats the battery in the same way as any other technology; i.e., it reaches parity with traditional thermal plants in the volumes being dispatched via the BM.
In the period before 2027 - before technical parity is reached and numbers are below 100% - we blend current dispatch rates with those coming out of the model for both system and energy dispatch rates.
After 2027, when percentages reach 100%, we use numbers coming out of the model.
Modelling battery optimisation within the BM
Batteries are optimised via a linear programme in the BM, in a similar way they are optimised in Day Ahead and Intraday markets.
Given the observed higher dispatch rates of BESS over 2024 and into 2025, a battery is now ‘more’ likely to be dispatched within the BM, if it is in-merit and available. ‘In-merit’ means it is priced competitively, and ‘available’ means it has sufficient headroom and/or footroom to increase or decrease it’s output at short notice, doing a offer or a bid.
We optimise in the BM after Day Ahead and Intraday positions are set
The BM now represents another set of optimisations, taking place after the day-ahead position (set by day-ahead wholesale trading and any dynamic frequency response contracts) and the intraday position (which is set by a 2h rolling window across the delivery day, assuming 2 hours of foresight of intraday prices).
The BM position is decided using the regional BESS dispatch rate for both bids and offers in system and energy actions, the bid / offer prices, battery parameters like duration and cycling, and the cost of rebalancing any actions taken - assumed to be in intraday markets - to maintain a physical state of charge. Of course, it also takes into account the prior position of the battery - namely how much flexibility remains to dispatch within the BM. We also give the model some foresight of what potential BM actions might be.
An example of daily dispatch within the BM is shown below.
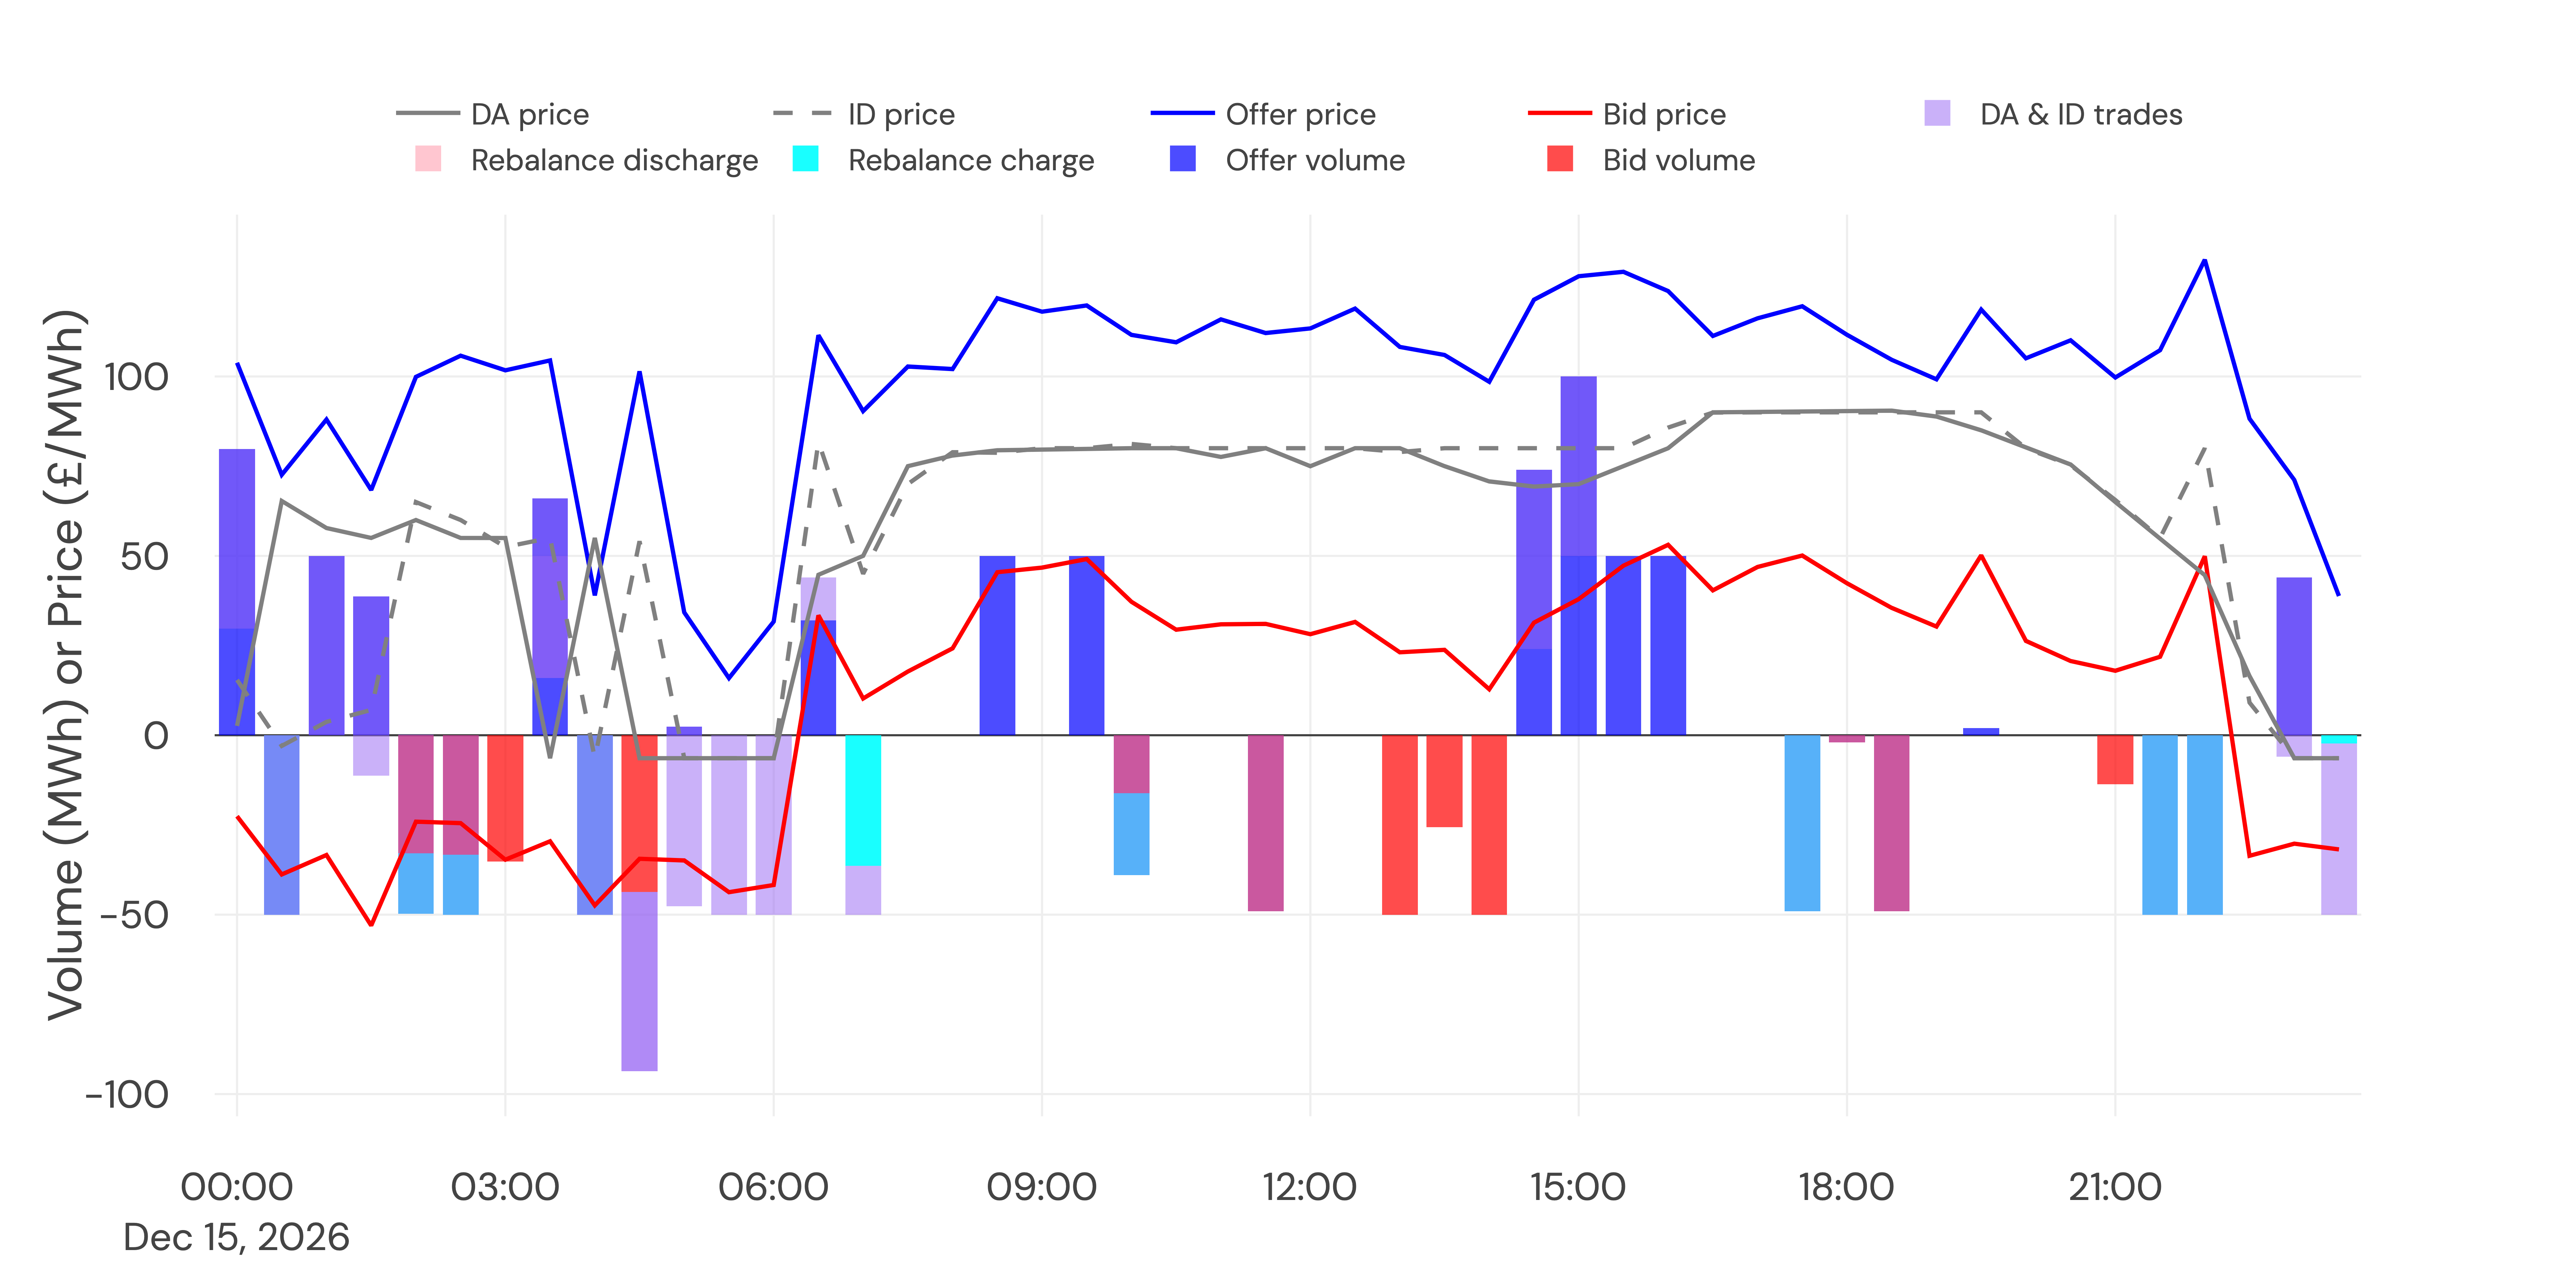
London, 2h, 2c battery doing a merchant-focussed strategy.