Key takeaway: The model seeds projections with a synthetic reference year — each calendar month drawn from the historical year (2016 to 2025) whose simulated prices sit closest to the ten-year median for each state.
A reference year is a representative historical period used to seed future weather and outage profiles. It drives demand, solar and wind load factors, hydro, and generation outages in the forecast.
A synthetic reference year is a calendar year built by stitching together months drawn from different historical years — January might come from one year, February from another, March from a third, and so on. The same month-to-year mapping is applied to every forecast year, so the seeded weather pattern repeats annually across the projection.
Months are chosen to match the ten-year median as closely as possible
The synthetic year is selected in four steps, shown in the animation below.
- Run the candidates: A full forecast is run for each of the ten candidate reference years (2016 to 2025), so that each one seeds every forecast year with its own weather, demand and outage patterns. For each state, forecast year and calendar month this gives ten simulated prices and battery spreads, and the ten-year median is the middle value of those ten.
- Sample synthetic years: A thousand synthetic years are then sampled, each one assigning a historical year to every calendar month. Each sample gives one annual price and one spread per state and forecast year, which are compared with the values implied by the ten-year medians.
- Rank: Every sample is scored by its largest percentage gap to the median across all states, forecast years (2026 to 2031) and measures (prices and spreads), so a sample is only as good as its worst state.
- Select: The top-ranked sample becomes the synthetic reference year. Its month-to-year mapping is held fixed across all scenarios and forecast years.
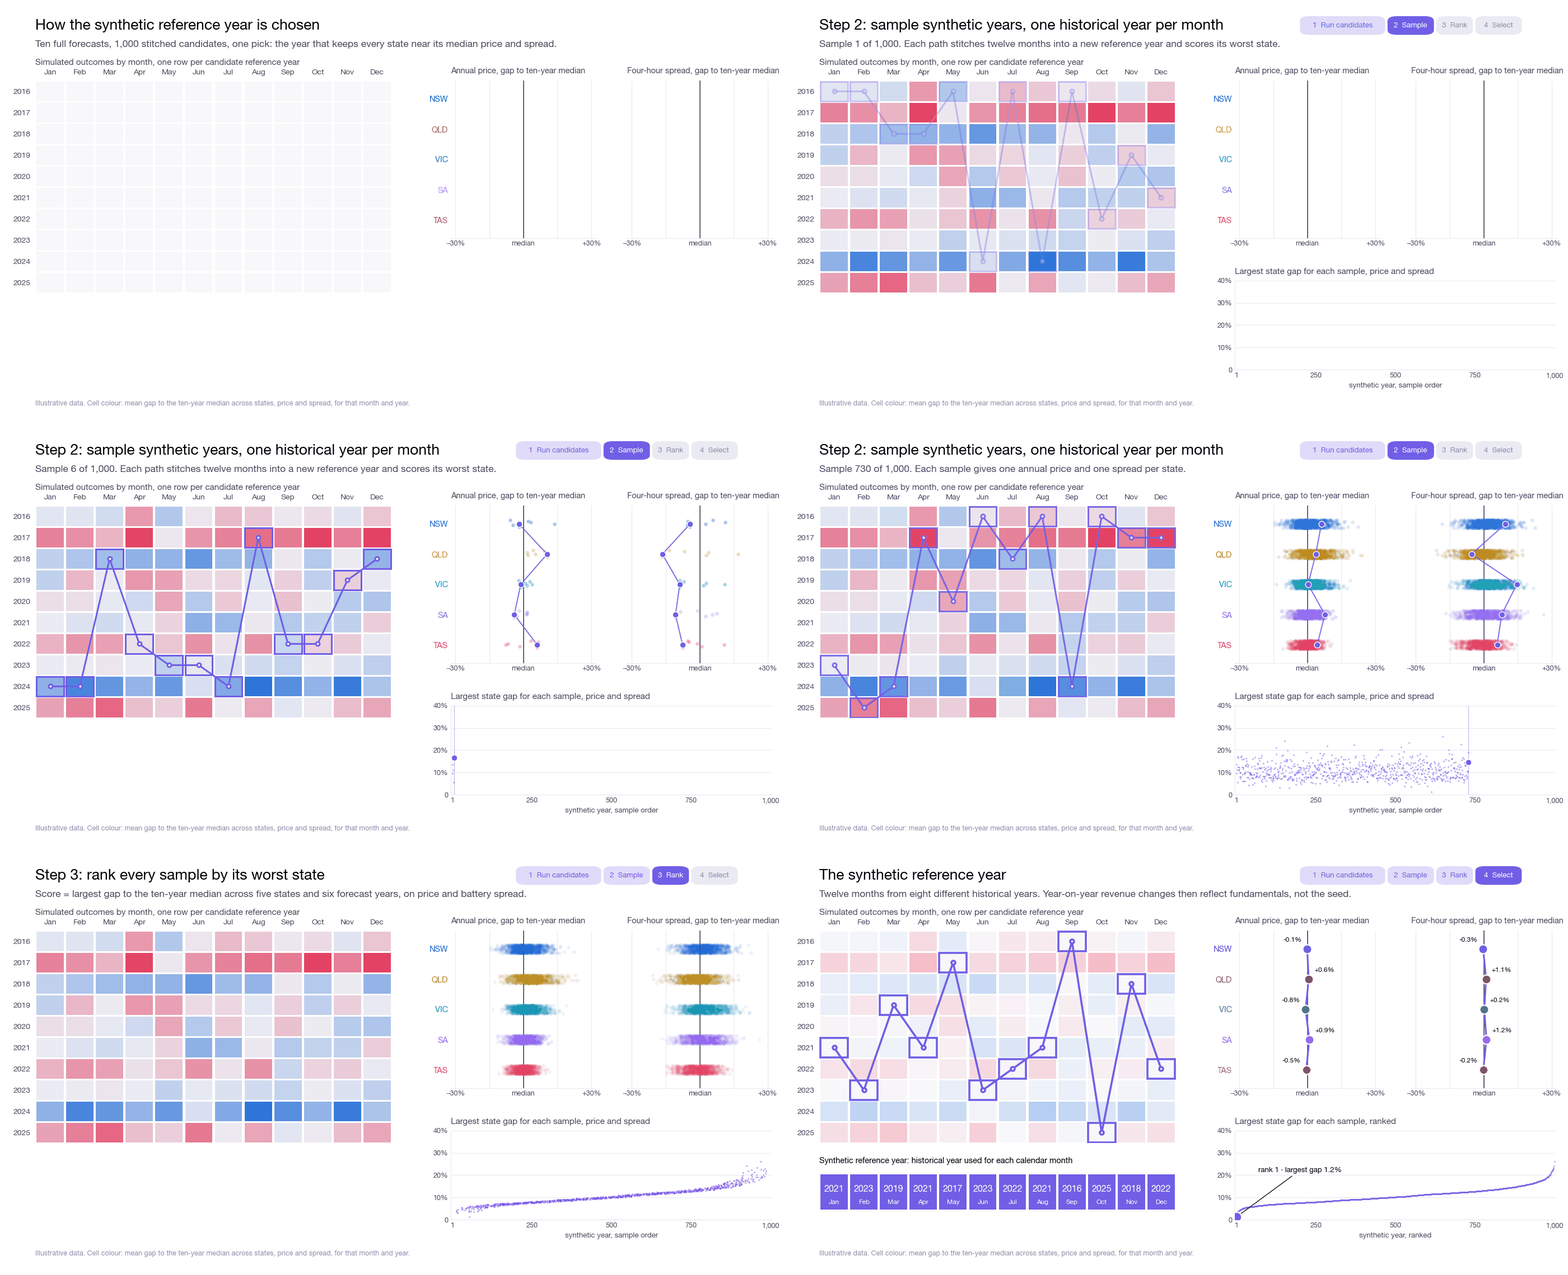
No single historical year sits close to the median in every state at once, so the selection picks month-year pairs that keep every state close to its typical prices.
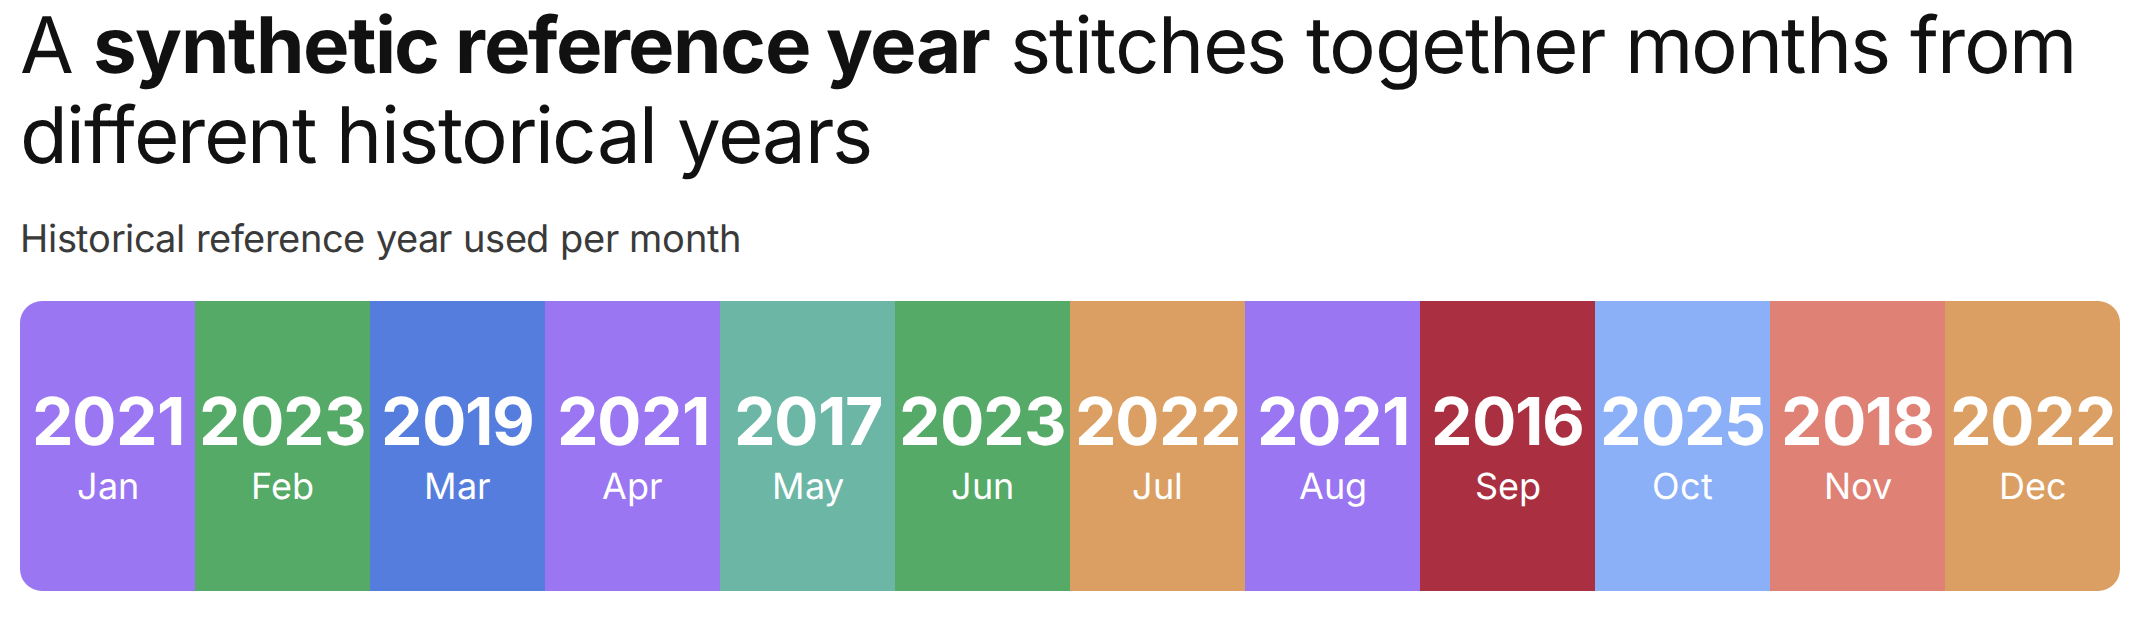
Because the mapping is fixed, year-on-year revenue differences reflect fundamentals rather than seed selection. A small amount of regional bias remains within each forecast year, but materially less than under any single-year choice.
Seeding preserves calendar day-of-year alignment
Each calendar month of the forecast is seeded with weather and outage data from its assigned historical year, preserving calendar day-of-year alignment. For example, 15 March of the forecast is seeded from 15 March of the assigned reference year. The same mapping is applied consistently across demand, renewable traces, hydro, generator outages, and commodity prices.
Months drawn from years prior to the introduction of 5-minute settlement require interpolation of historical settlement data to 5-minute granularity.
Alternative approaches considered
- Using a single historical reference year: Rejected because no single year produces a typical price across every state at the same time. Any single-year choice imposes a regional price bias that cannot be corrected downstream.
- Cycling between ten historical years: Used by the Australian Energy Market Operator (AEMO) in some of its modelling. Rejected because it becomes unclear whether revenue changes from year to year come from real market fundamentals or from which reference year was assigned to that year.
- Random sampling from historical distributions: Rejected because adding randomness makes the model harder to interpret, makes it difficult to capture how demand, wind, and solar move together, and obscures whether a year’s revenues reflect real market drivers or sampling noise.