How the ERCOT model compares to reality, both as a forecast of 2026 published ahead of time and as a backtest of historical prices and battery revenues.
The model is validated in two ways. The first compares the published quarterly forecasts for 2026 against the battery spreads that have actually been realized so far this year. The second is a conventional backtest, in which the model is run on historical inputs and its prices and dispatch are compared against what happened.
The 2026 forecasts compared against realized battery spreads
Each quarterly release publishes a monthly forecast of the two-hour top-bottom spread (TB2) for the years ahead. The TB2 spread is the gap between the sum of the two highest-priced hours and the sum of the two lowest-priced hours in each day, and represents the revenue available to a two-hour battery completing one cycle per day on energy arbitrage alone. The chart below plots the realized 2026 TB2 spread against the forecast from each of the three releases that preceded it. Each release is drawn solid over the quarter it was the live forecast for, and dashed over the rest of the year.
This is not a true backtest. Each release was built with the inputs available at the time it was published, and none of them had sight of true 2026 weather, outages or demand. The comparison measures how well the forecast anticipated the year, rather than how well the model reproduces it when given the right inputs.
Spreads are the four-hub average of Houston, North, South and West, calculated from real-time prices and expressed in real 2026 dollars. The forecasts are drawn from the Central Scenario of each release.
The blended forecast landed within 6% of realized spreads over January to September
Each release is judged against the first quarter after its publication, which is the period it was the live forecast for. Blending the three releases over January to September gives a forecast of $4.06/kW-month against a realized average of $3.83/kW-month, a gap of around 6%.
| Period | Release in effect | Forecast ($/kW-month) | Actual ($/kW-month) |
|---|---|---|---|
| January to March | January 2026 release (Q4 2025) | 4.27 | 4.52 |
| April to June | April 2026 release (Q1 2026) | 4.63 | 3.37 |
| July to September | July 2026 release (Q2 2026) | 3.27 | 3.59 |
| January to September | Blended | 4.06 | 3.83 |
Individual months are more prone to miss than quarters or years
The forecast is built to get the multi-year picture right rather than to call a given month. Three features of the model explain most of the month-level gaps in the chart.
- Representative weather year: Releases prior to October 2026 replayed a single historical weather year, 2024, across the forecast horizon. The forecast for any one month therefore reflects the weather of that month in 2024, not a prediction of 2026 weather. The October 2026 release replaces this with a synthetic weather year stitched from 2020 to 2025.
- Replayed scarcity: Scarcity pricing in the replayed weather year recurs in the same month of every forecast year. The August 2026 forecast in the January release reflects scarcity in the replayed weather year that did not materialize in August 2026, and the April and July releases revised it down.
- Normal-weather outturn: Where 2026 weather turned out milder than the replayed year, as in May and June, realized spreads fell below every release. Where it turned out tighter, as in September, realized spreads sat above every release.
Backtesting the price model on historical inputs
A core aspect of Modo Energy’s data science work is ensuring that the mathematical modeling and underlying assumptions of the models are grounded in market fundamentals and produce realistic outcomes. To validate this, the models are backtested against historical data, assessing their accuracy in capturing market prices and asset dispatch behavior.
Real historical data is used wherever possible in the backtest. This allows calibration of the more uncertain elements of the grid, such as plant bidding behavior, as accurately as possible. Historical inputs used in the 2025 backtest include:
- Renewable output: Wind and solar capacity factors
- Bidding behavior: Generation and storage bidding behavior at the site level
- Demand: Metered demand data from ERCOT
- Transmission: Historical transmission topology to reflect outages and de-rates
The price time series captures the timing and severity of scarcity
Revenues for battery assets are in large part driven by the frequency and severity of scarcity pricing. Many factors can drive scarcity, including load, plant outages and renewable production. As an example, evening peak (6pm to 7pm) prices were very low on October 4th due to high wind generation of 19 GW, compared to an 11 GW average for October as a whole.
The error distribution shows no systematic bias
An error distribution is used to verify that the model’s predictions are not systematically higher or lower than reality, meaning the errors are evenly distributed around zero.
The intraday price shape reproduces the ERCOT duck curve
The intraday price shape in ERCOT has three notable features which drive spreads:
- Morning peak: On cold mornings in the winter months, demand tends to rise before solar generation picks up with the sunrise. This can create a morning peak in prices, where storage and thermal generation fill the gap to match supply with demand.
- Solar trough: Due to the rapid deployment of solar assets in ERCOT over the past few years, a notable drop in prices occurs during solar hours.
- Evening peak: Evening demand tends to stay near the mid-afternoon peak, particularly in the hot summer months, even as the sun sets and solar generation falls off for the day. This creates a peak in net load, or demand minus wind and solar generation, that tends to correspond with the day’s peak in prices.
Nodal basis is evaluated on around-the-clock prices
In the model, as in ERCOT’s security-constrained economic dispatch (SCED), the price at a given node reflects the marginal cost of delivering additional power at that location. Transmission constraints cause this cost to vary between different zones and between nodes within the same zone. Around-the-clock (ATC) prices are used to evaluate how well the model captures this.
Backtesting the dispatch model against the ME ERCOT BESS 2-hour index
The energy and ancillary service prices are leveraged by the dispatch model to create realistic revenues for individual battery assets, which are compared to Modo Energy’s proprietary ME ERCOT BESS 2-hour index.
The following chart shows a 2-hour sample asset run for 2024 alongside the 2-hour index’s average revenue stack, with whiskers indicating the best- and worst-performing assets as well as the 75th and 25th percentiles:
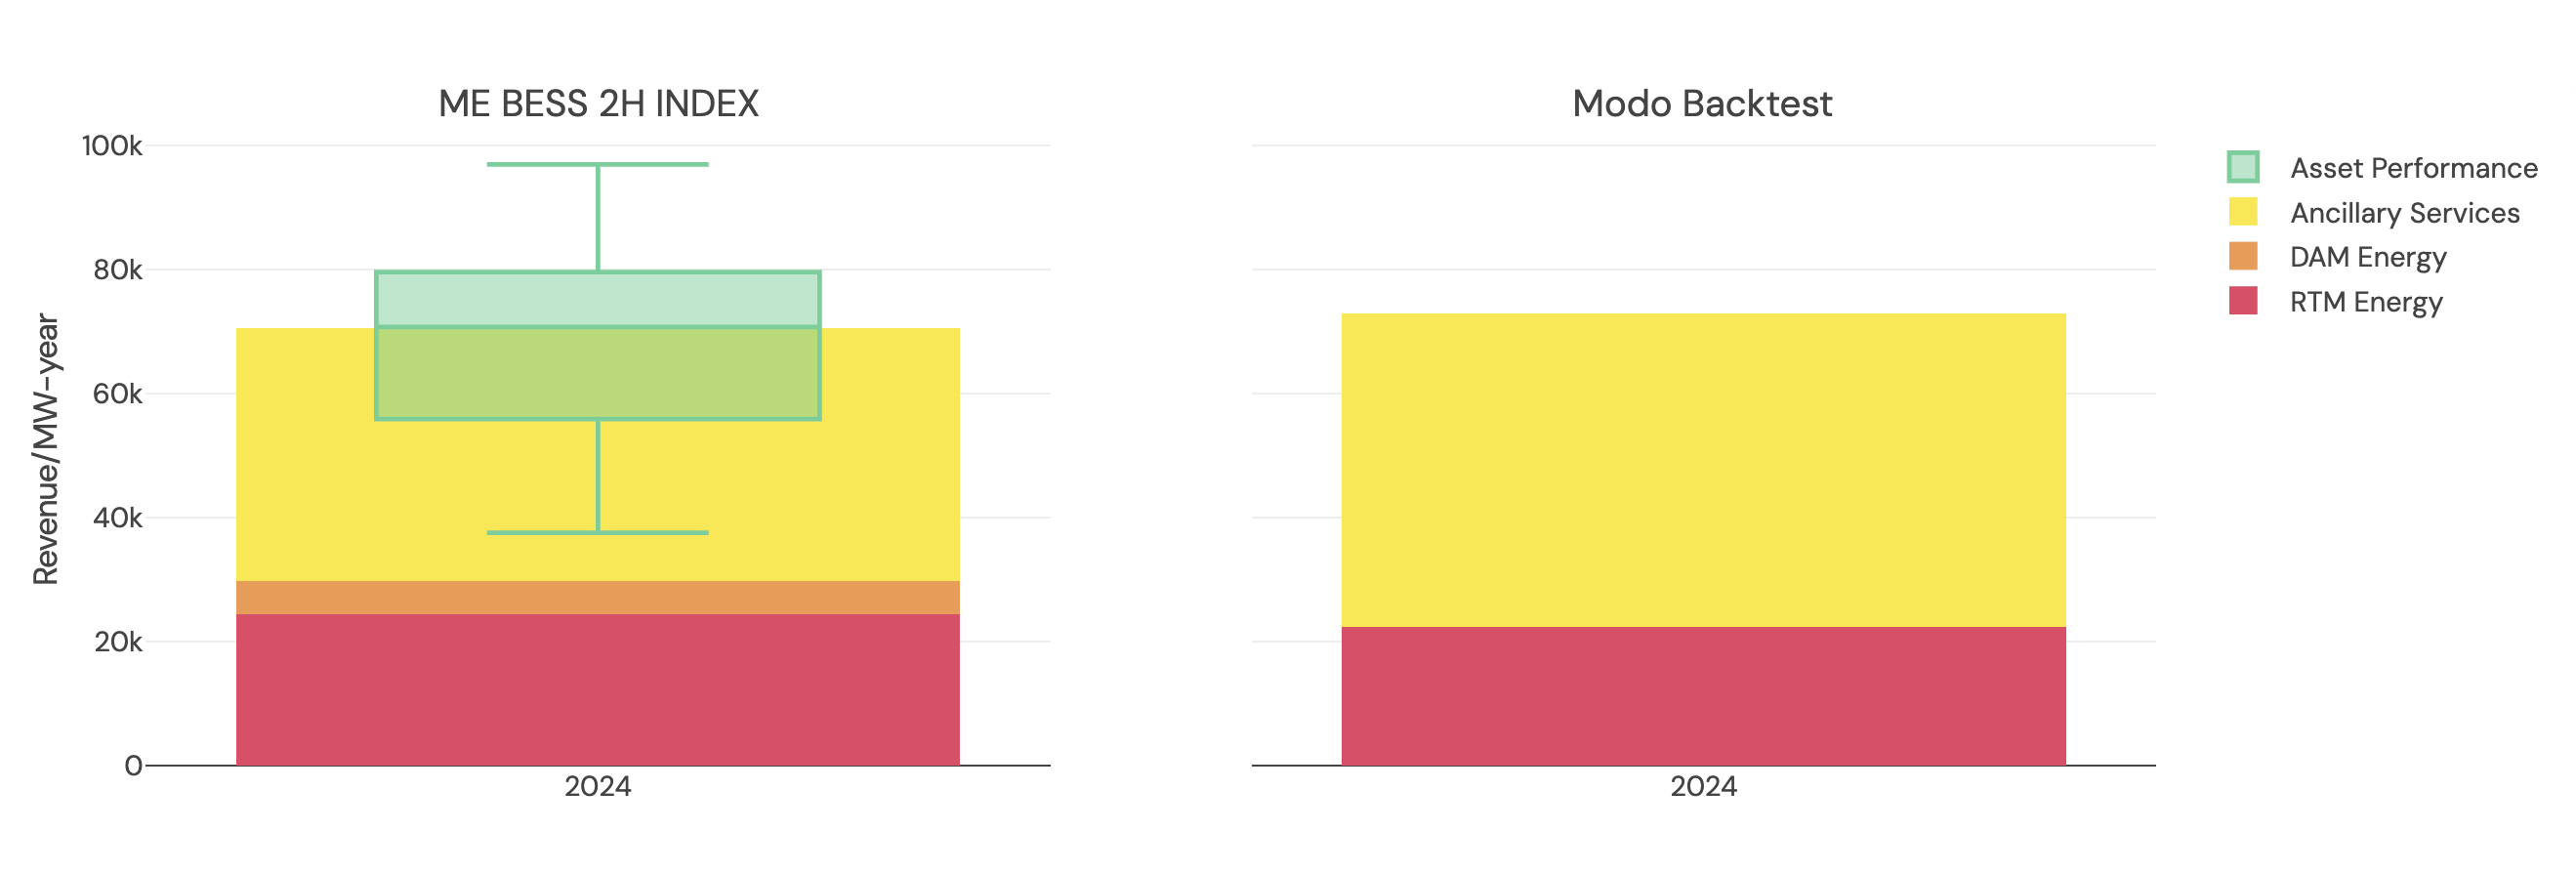
The Modo Energy backtest dispatch model revenue run uses West hub prices.
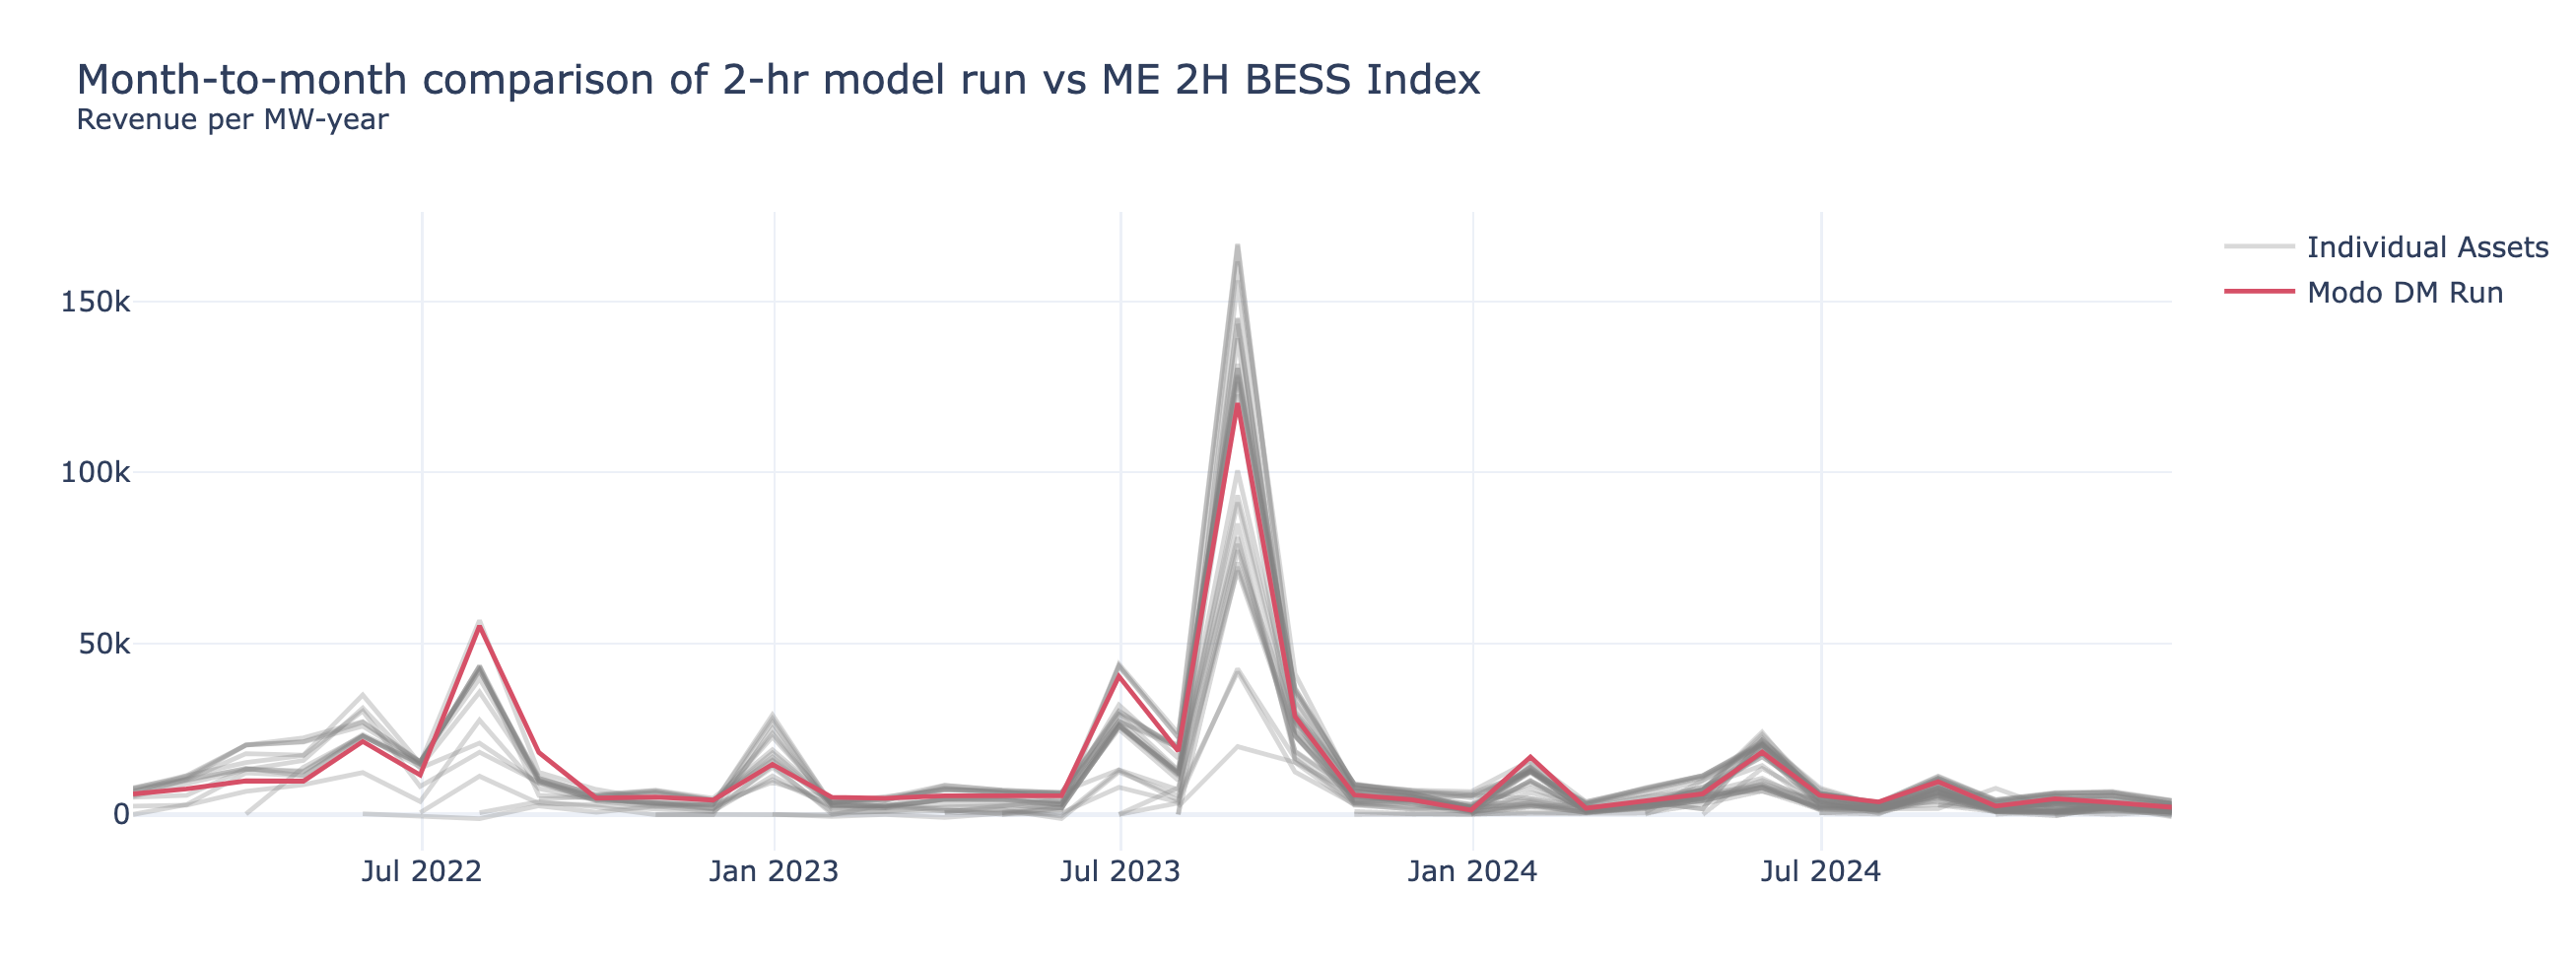
The model has been stress-tested during scarcity-pricing periods in 2022 and 2023 and demonstrated revenue results that fall within the range of the ME index, as shown below: