Modelled revenues are adjusted to reflect real-world trading performance, ensuring forecasts align with what batteries actually earn.
At a glance:
- Benchmark: Forecasted revenues are calibrated against the Modo Energy BESS Index, tracking all operational GB battery sites
- Approach: The 75th percentile of fleet revenues is used to keep calibration relevant to newer, better-performing assets
- Adjustment: Modelled revenues are reduced by 15-25% depending on the scenario, reflecting real-world factors like availability, imperfect foresight, and market competition
- Result: Near-term forecasted revenues align with actual market performance
Modelled revenues need adjustment to reflect real-world performance
A fundamentals-based dispatch model calculates theoretical revenues assuming optimal trading decisions and perfect market knowledge. In practice, operational realities mean actual revenues are lower than these theoretical optimums.
The calibration process compares modelled revenues against actual fleet performance and applies an adjustment factor. This ensures the forecast reflects what batteries genuinely earn, rather than what they could earn under idealised conditions.
This calibration is currently applied to GB battery forecasts.
The Modo Energy BESS Index provides the benchmark for real-world revenues
The Modo Energy BESS Index tracks revenues for every battery energy storage asset above 7 MW across Great Britain. As of early 2026, this covers over 190 sites representing nearly 7 GW of installed capacity.
The index records earnings across all major revenue streams:
- Day-ahead wholesale markets: Revenue from trading power one day ahead
- Intraday markets: Revenue from shorter-term trading closer to delivery
- Frequency response: Payments for providing grid-balancing services
- Balancing Mechanism: Revenue from accepting instructions from the system operator
- Capacity Market: Fixed payments for being available during system stress
This comprehensive dataset provides the real-world benchmark against which modelled revenues are compared.
The 75th percentile approach keeps calibration relevant to new assets
The GB battery fleet contains assets ranging from brand new to over seven years old. Performance varies significantly across this range.
-
Newer assets benefit from improved cell technology, better thermal management, and more sophisticated optimisation strategies. These batteries typically achieve higher revenues per MW of capacity.
-
Older assets may have experienced significant degradation from nameplate capacity. They often have more conservative cycling strategies and may accept lower prices in competitive markets due to lower opportunity costs.
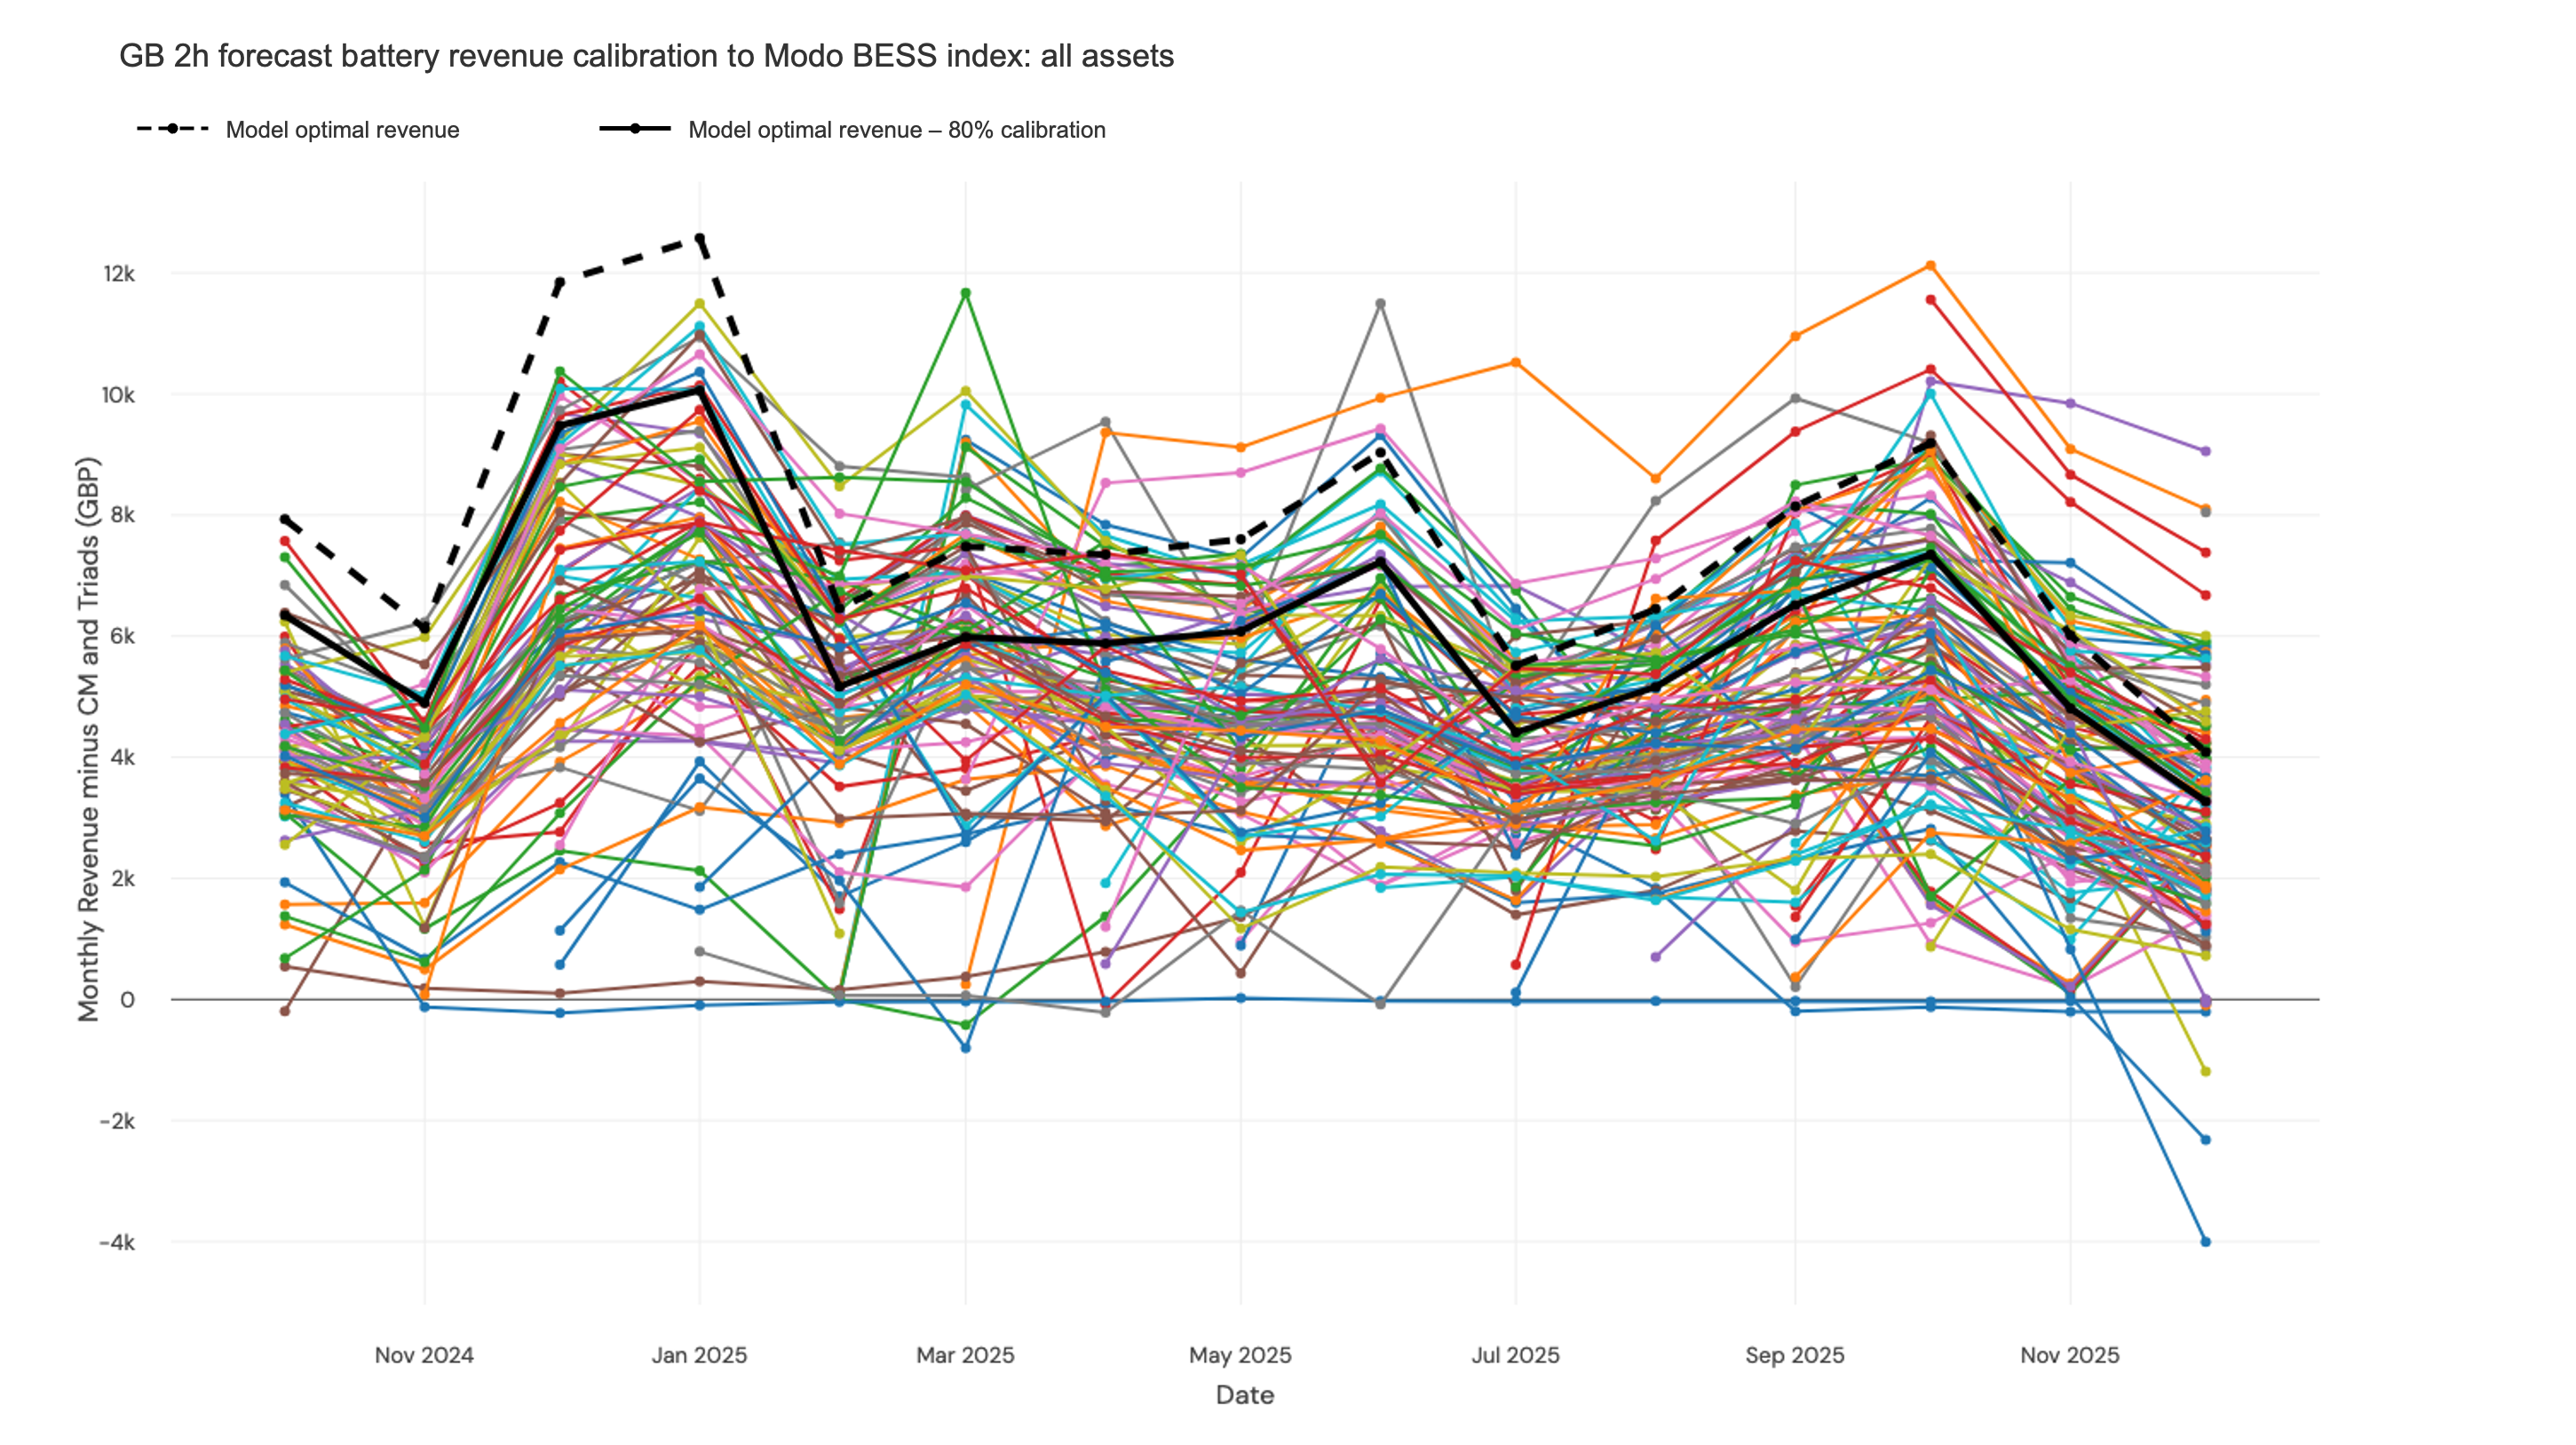
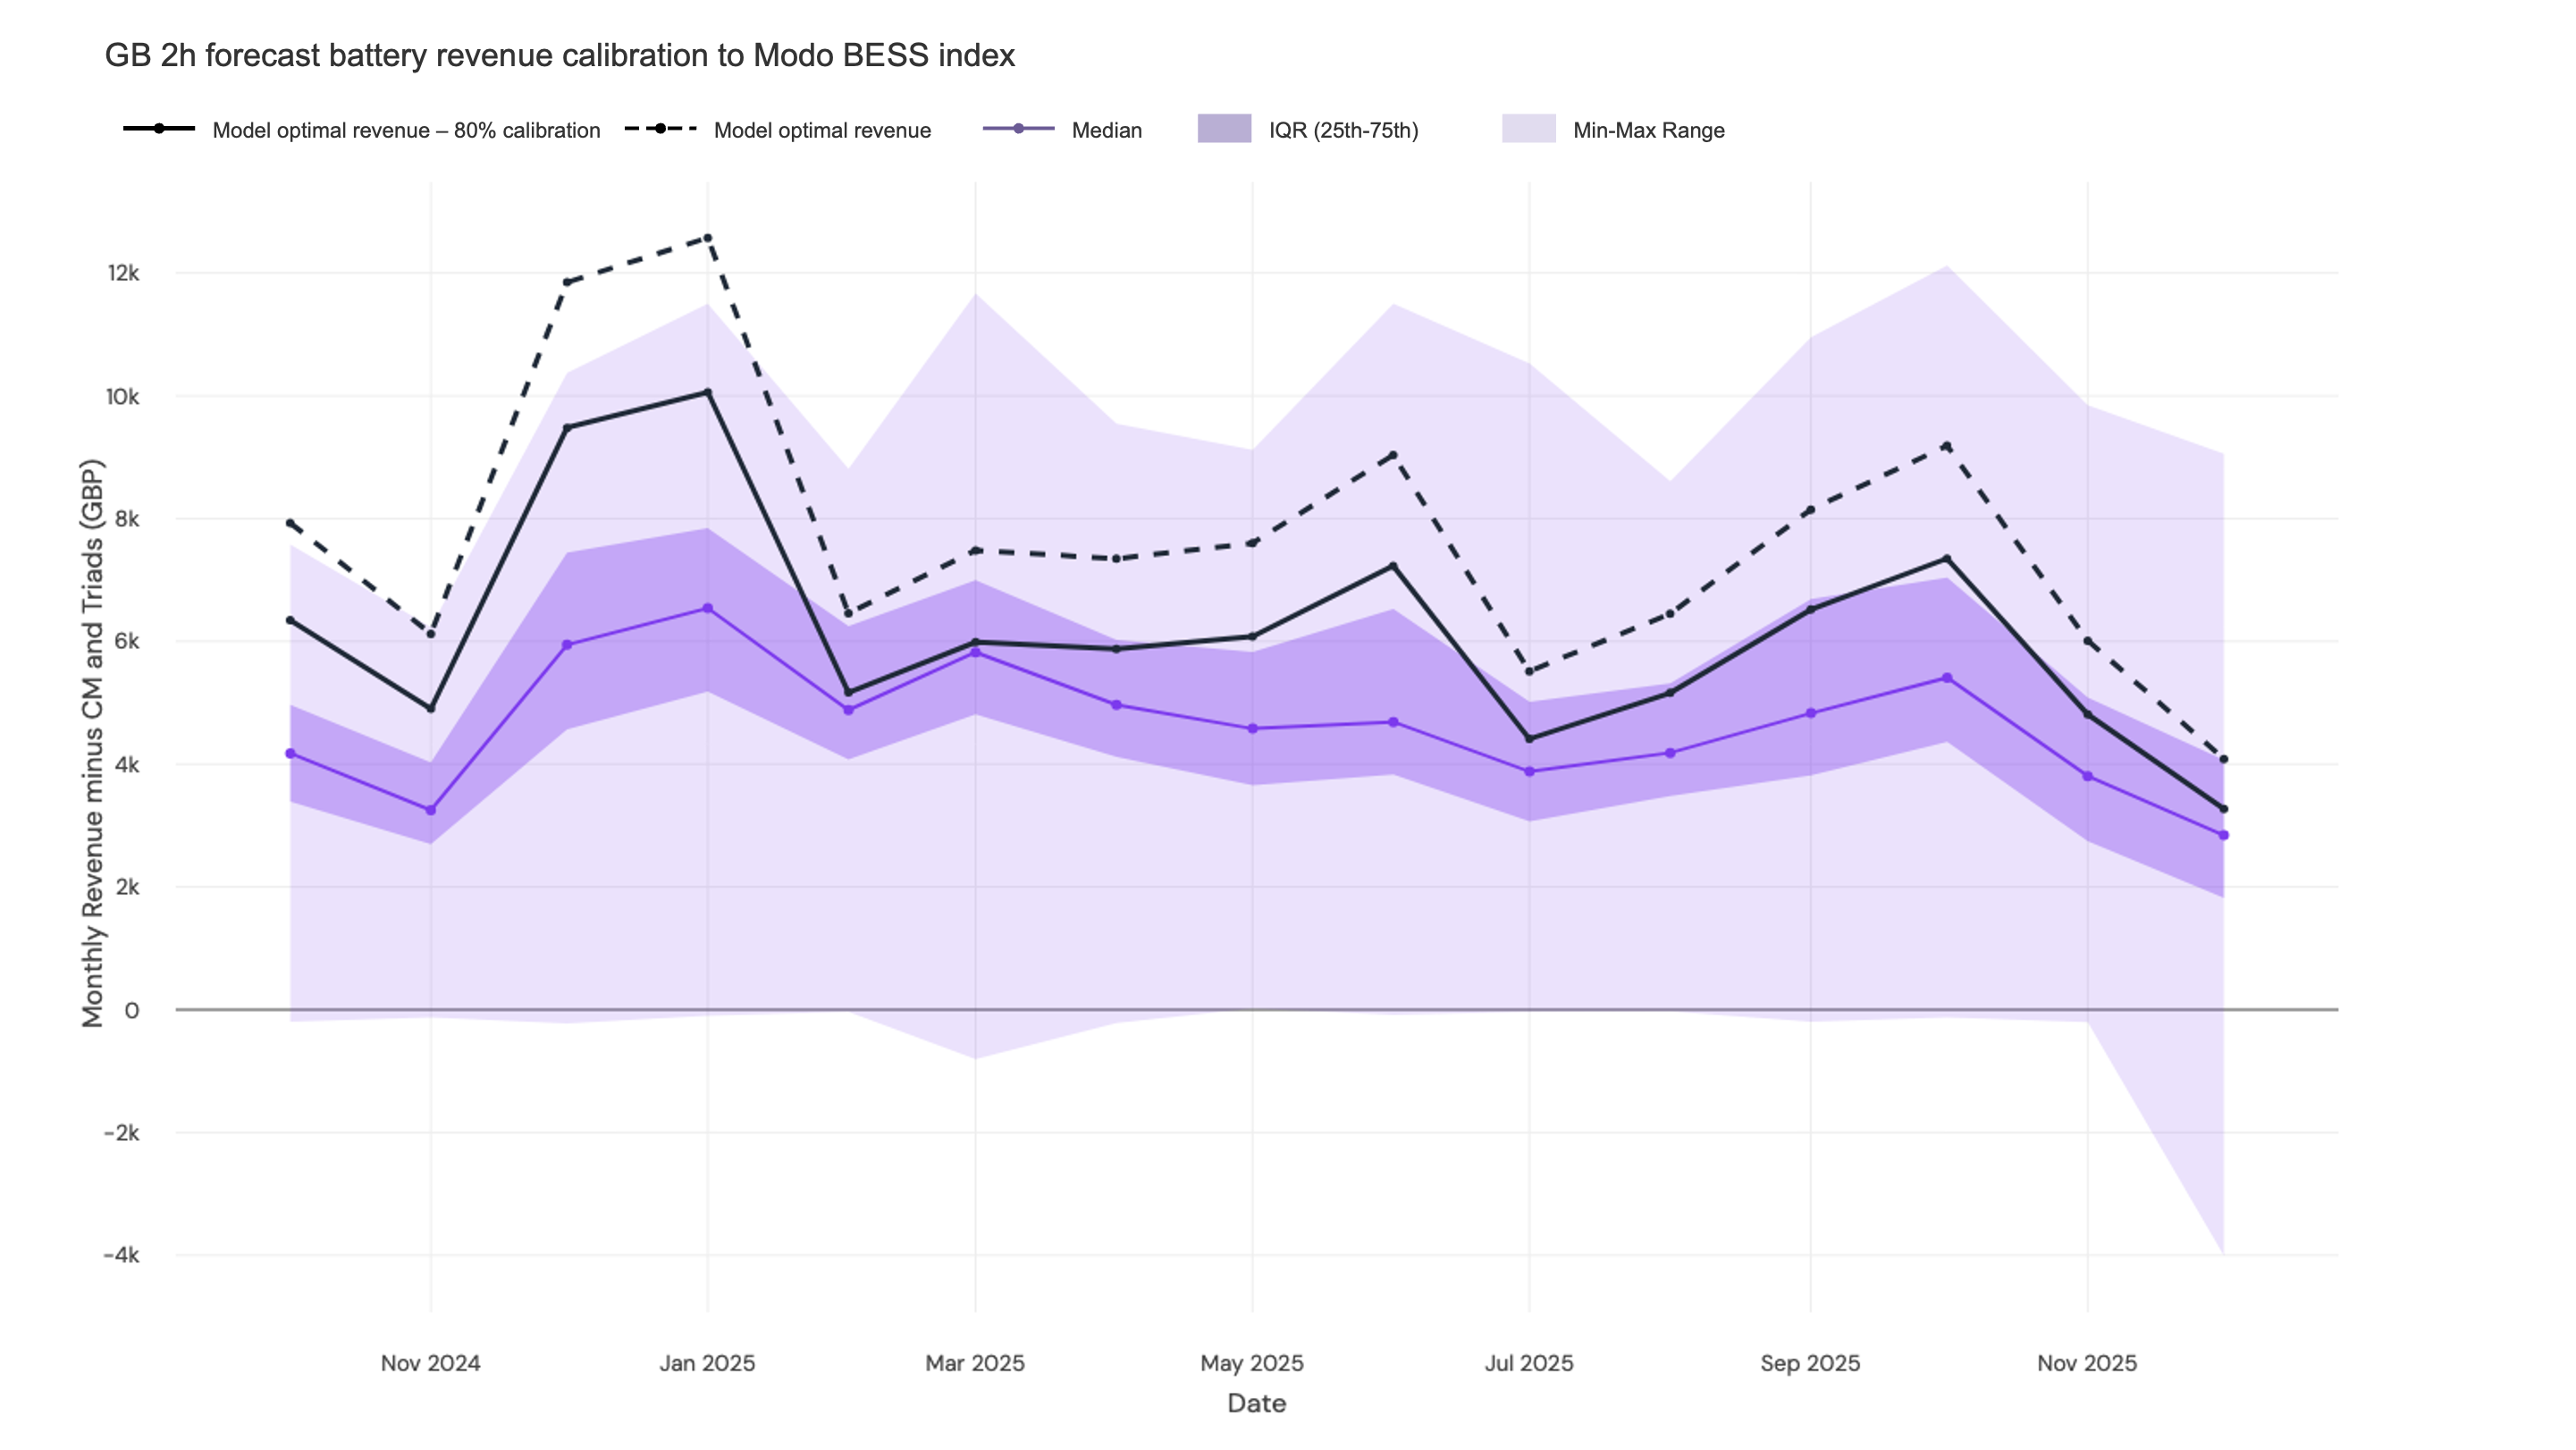
Using the 75th percentile of fleet revenues (rather than the median) ensures the calibration remains representative of modern, well-operated battery projects. This is the most relevant benchmark for investors evaluating new-build projects or recently commissioned assets.
Several real-world factors explain the gap between modelled and actual revenues
Several operational factors reduce real-world revenues below the model’s theoretical optimum. We list the main ones below. Because these effects overlap and are difficult to quantify in isolation, calibration against actual fleet performance is the most reliable way to capture them.
-
Imperfect foresight: The model optimises with knowledge of future prices that operators cannot have in real time. Real-world trading decisions are made with limited visibility of upcoming price movements.
-
Availability: Batteries are not available 100% of the time due to grid outages, transformer maintenance, or cell issues. This accounts for approximately 5% of the revenue difference. For more information on observed availability of utility scale BESS, ask Ko about battery availability in GB, NEM and ERCOT — what’s the average uptime for investment cases?. The 75% percentile of ‘binary’ availability for the GB fleet in 2025 was 99%; however partial availability (when the battery has a reduced capacity) can increase the revenue impact of availability - though this overlaps with the state of charge buffers below.
For a GBP/MWh number on asset availability, the model assumes a 99% figure.
-
State of charge buffers: Batteries often have a buffer at the bottom and top of their operational range of state of charge, to protect their hardware. For example, there could be a limit in place where they don’t discharge to less than 5% of their energy capacity, as very deep discharges can degrade cells.
-
Degradation: Actual usable capacity declines over time, whereas in the backtest calculation that is used for calibration, we assume nameplate capacity.
-
State of charge inaccuracies: Reported state of charge of operational assets is not always 100% accurate, which can lead to non-optimal trading decisions.
-
Market competition: Frequency response markets are competitive. Not every submitted bid wins a contract. While the model assumes a level of market saturation based on historical patterns, individual asset success varies.
Forecast revenues are scaled down by the overall calibration factor, as opposed to, for example, turning the asset off for randomly to mimic downtime.
Calibration factors vary by scenario
Different macro scenarios apply different calibration adjustments to reflect varying levels of optimism about asset performance:
| Scenario | Calibration Factor |
|---|---|
| Central case | 80% of modelled revenues |
| High case | 85% of modelled revenues |
| Low case | 75% of modelled revenues |
For details on what drives each scenario beyond calibration, see the Scenarios page.
Calibration ensures near-term forecasts match market reality
By anchoring forecasted revenues to observed performance, the calibration delivers two key benefits:
-
Credibility: Near-term revenue projections align with what assets are actually earning today, providing confidence in the forecast methodology.
-
Accuracy: The adjustment captures the cumulative impact of all real-world factors—both those explicitly understood and those that are difficult to quantify individually.
The charts below show the calibration comparison across 2025. Each line represents one of the 130+ tracked assets, illustrating the range of performance across the fleet. This data is aggregated to derive the percentile benchmarks used for calibration.