Key takeaway: FCAS revenues are modelled through co-optimised dispatch simulation alongside statistical ML models trained on historical correlations, producing two complementary price series.
How we model FCAS market activity.
The model represents Frequency Control Ancillary Services (FCAS) using two distinct but complementary approaches: simulation-based pricing and statistical forecasting. These methods are run in sequence, allowing the system to capture both detailed dispatch-driven outcomes and broader market-based expectations for FCAS prices.
Co-optimisation with the energy market
When FCAS co-optimisation is enabled, the model includes FCAS alongside energy in its dispatch logic. FCAS demand is provided as an input, specifying the required volume of each service type at each time step. Storage units can commit a portion of their capacity to FCAS, either while charging or discharging, subject to their technical constraints. The simulation clears the FCAS markets by matching demand with available supply or penalising any shortfall at a high cost, representing the value of lost service.
FCAS prices reflect the cost of supplying one extra unit of each service, in the same way energy prices are set by the marginal generator. These simulated prices are saved along with the main market outputs and reflect the internal dynamics of the dispatch model.
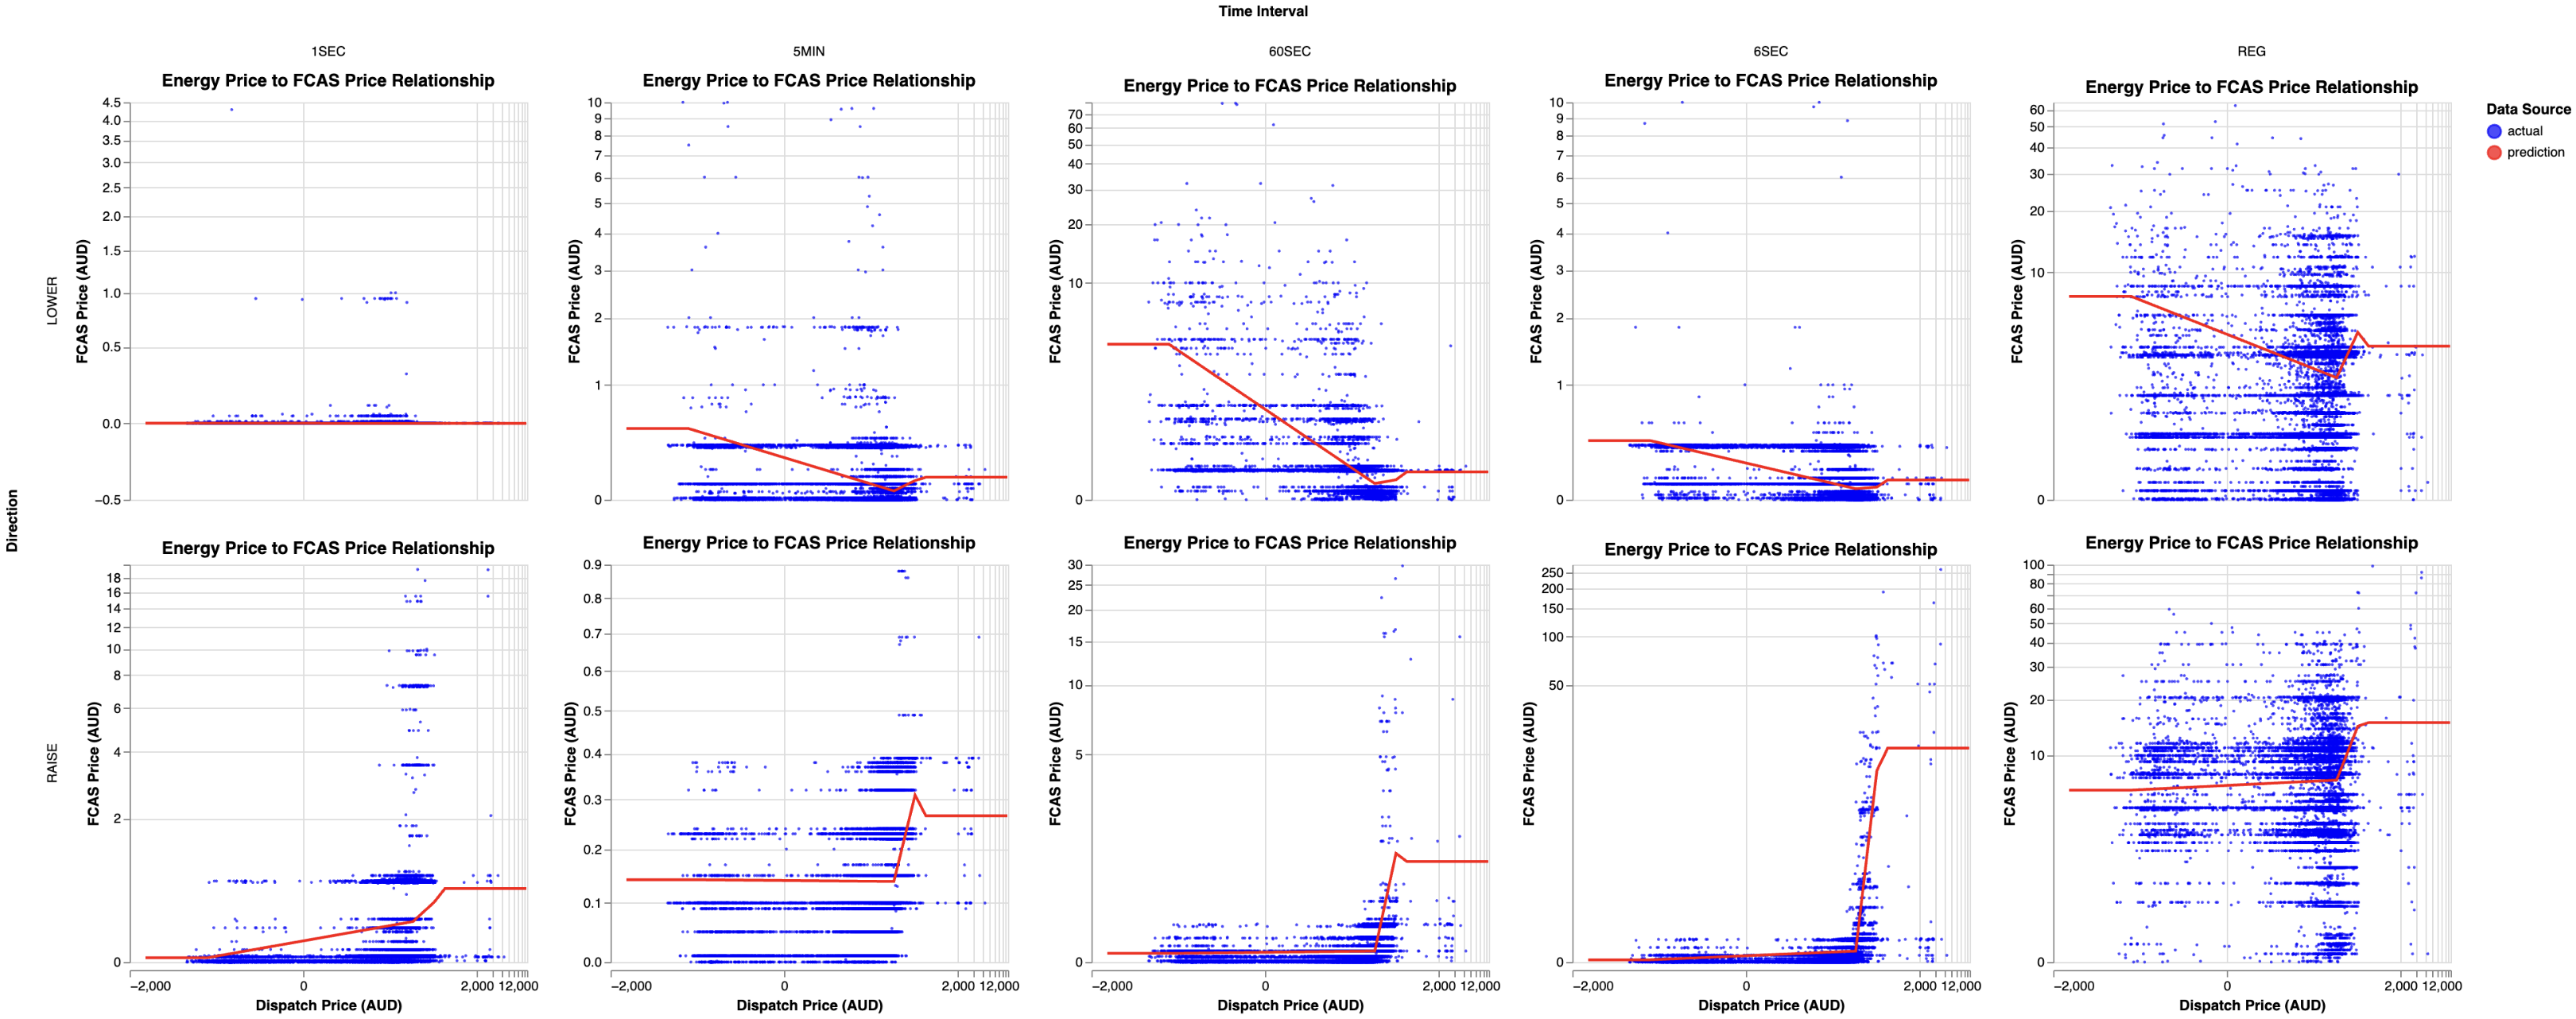
Following this simulation, a separate FCAS price forecasting step is executed. This process uses the energy prices produced by the simulation as input to pre-trained machine learning models that estimate FCAS prices based on historical correlations. These forecasted prices are not tied to dispatch outcomes or constraints; instead, they reflect typical market behaviour under similar pricing conditions. The forecast runs after every simulation, regardless of whether FCAS was actively modelled, and the results are stored independently from the simulation outputs.
This results in two possible FCAS price series: one generated from the co-optimised market simulation and one forecasted using statistical models. If the simulation runs without co-optimisation, the statistical-forecast prices are the only FCAS price output. When both are available, the statistical-forecast prices can be used for comparison, validation, or in scenarios where a less detailed but historically grounded view of FCAS is appropriate.
Importantly, there is no feedback loop between the statistical forecast and the simulation - the FCAS forecasts are always produced after the simulation concludes and do not influence dispatch decisions within the same run.
By decoupling the simulated and forecasted approaches, the model supports a wide range of use cases - from operational simulations that reflect dispatch constraints to broader strategic analyses that rely on historical trends.
FCAS islanding
Separate, higher FCAS prices can occur when a region is islanded - disconnected from the rest of the NEM, or at risk of it - and must meet its frequency control needs locally. This mainly affects South Australia and Queensland, at the edges of the grid. The model flags intervals where a region’s import capability plus local battery FCAS supply runs short, and applies elevated FCAS prices in those periods. These events are expected to become less frequent over time, as growing battery participation deepens contingency FCAS supply and interconnector upgrades strengthen regional ties.