The Balancing Mechanism is a significant and growing source of battery revenues in GB, and location matters.
Key takeaways:
- Location is critical: Revenues in the Balancing Mechanism vary by up to 2-3x depending on where a battery is sited
- Dispatch rates have improved: Battery dispatch in the BM steadily increased over 2024 and in 2025 settled at around 15%. Further improvements are expected and we assume batteries reach parity with gas plants by 2027
- Forecast revenues by GSP group: We forecast revenues based on the 14 GSP regions, driven by constraint based logic and national pricing
The Balancing Mechanism balances supply and demand in real-time
The Balancing Mechanism (BM) is how National Grid ESO balances electricity supply and demand in real-time. When there’s too much generation, they pay plants to reduce output (a “bid”). When there’s not enough, they pay plants to increase output (an “offer”).
Batteries can participate by offering to charge (absorbing excess power) or discharge (providing power when needed). Unlike wholesale markets where everyone gets the same price, BM revenues depend heavily on location because the grid operator needs assets in specific places to resolve local constraints.
New to the BM? Check out The Energy Academy for a detailed introduction.
Location drives significant variation in BM revenues
- London and the South East offer the highest BM revenues — high demand, interconnector flows, and the need for flexible generation to balance local constraints
- Scotland and East Anglia also offer strong BM opportunities due to wind-driven constraints
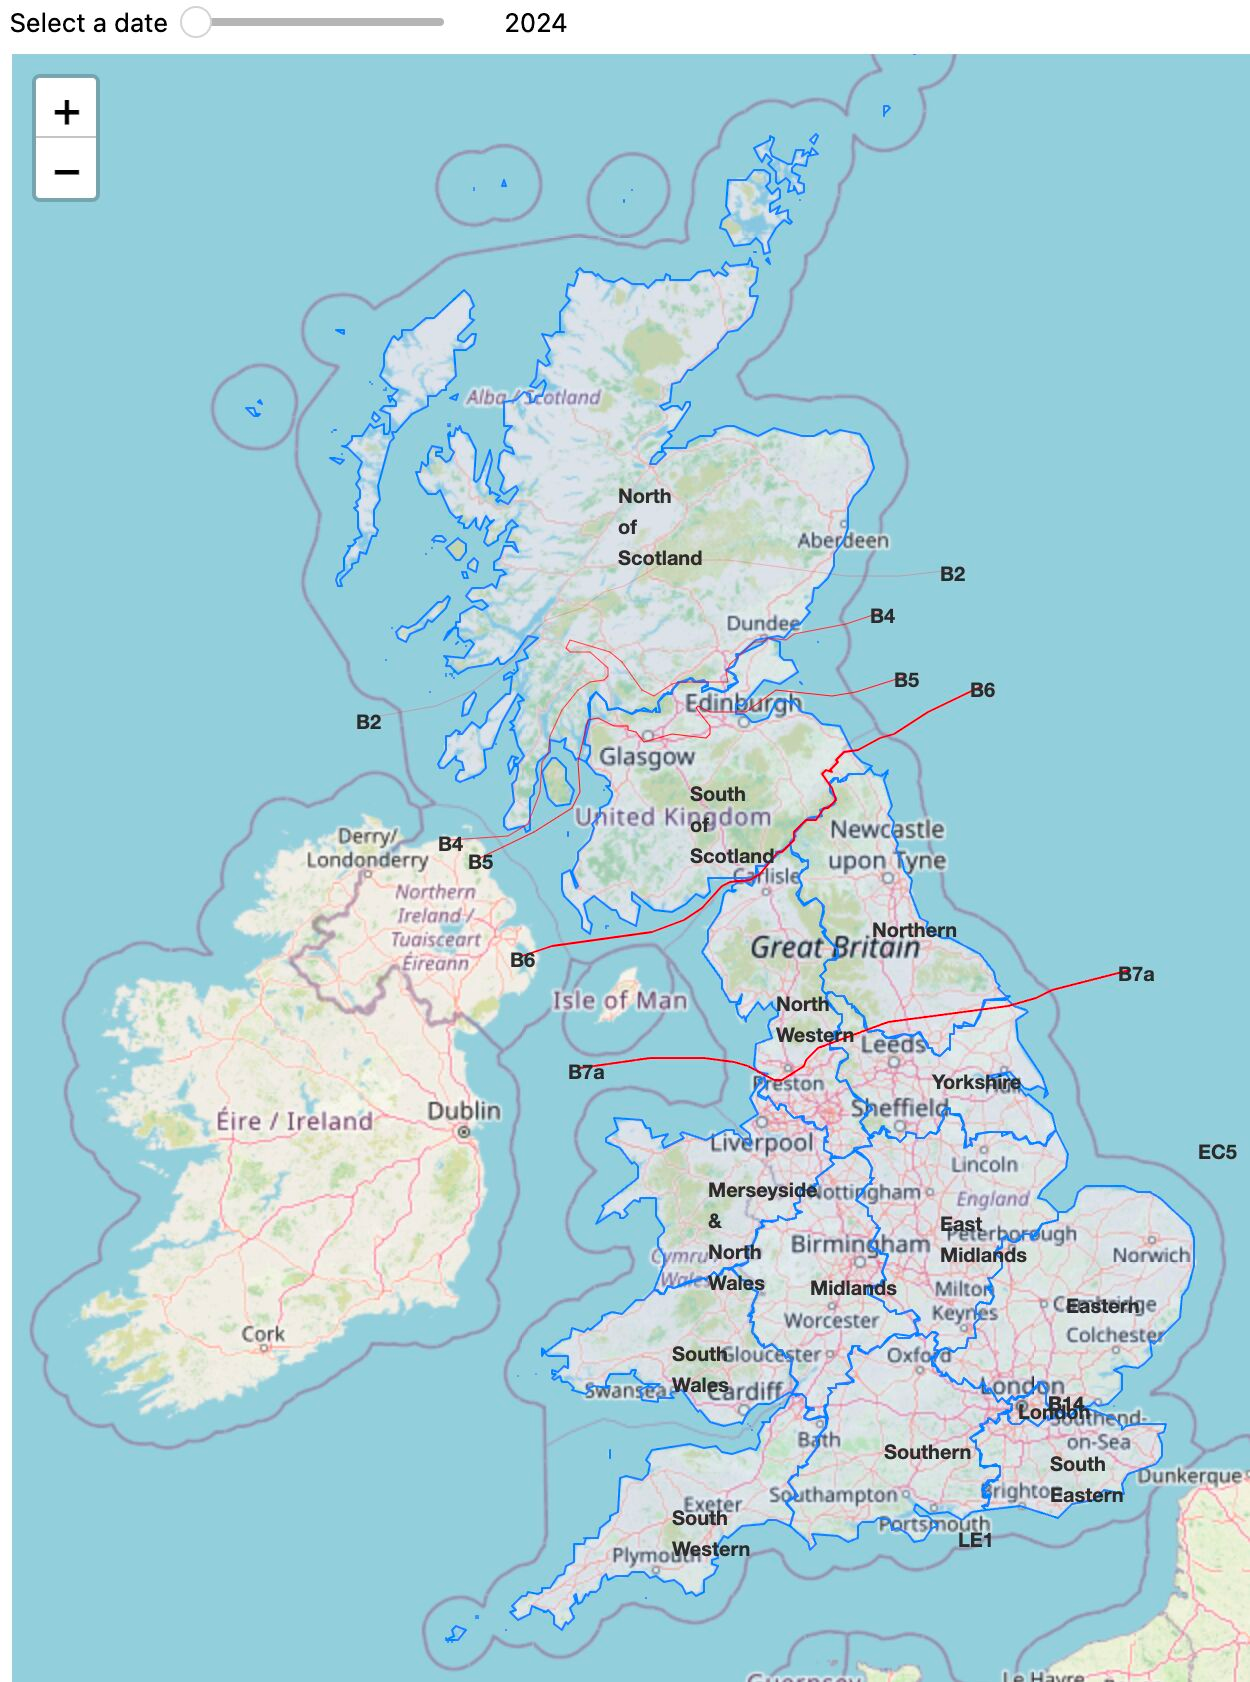
The core problem: more wind than wires
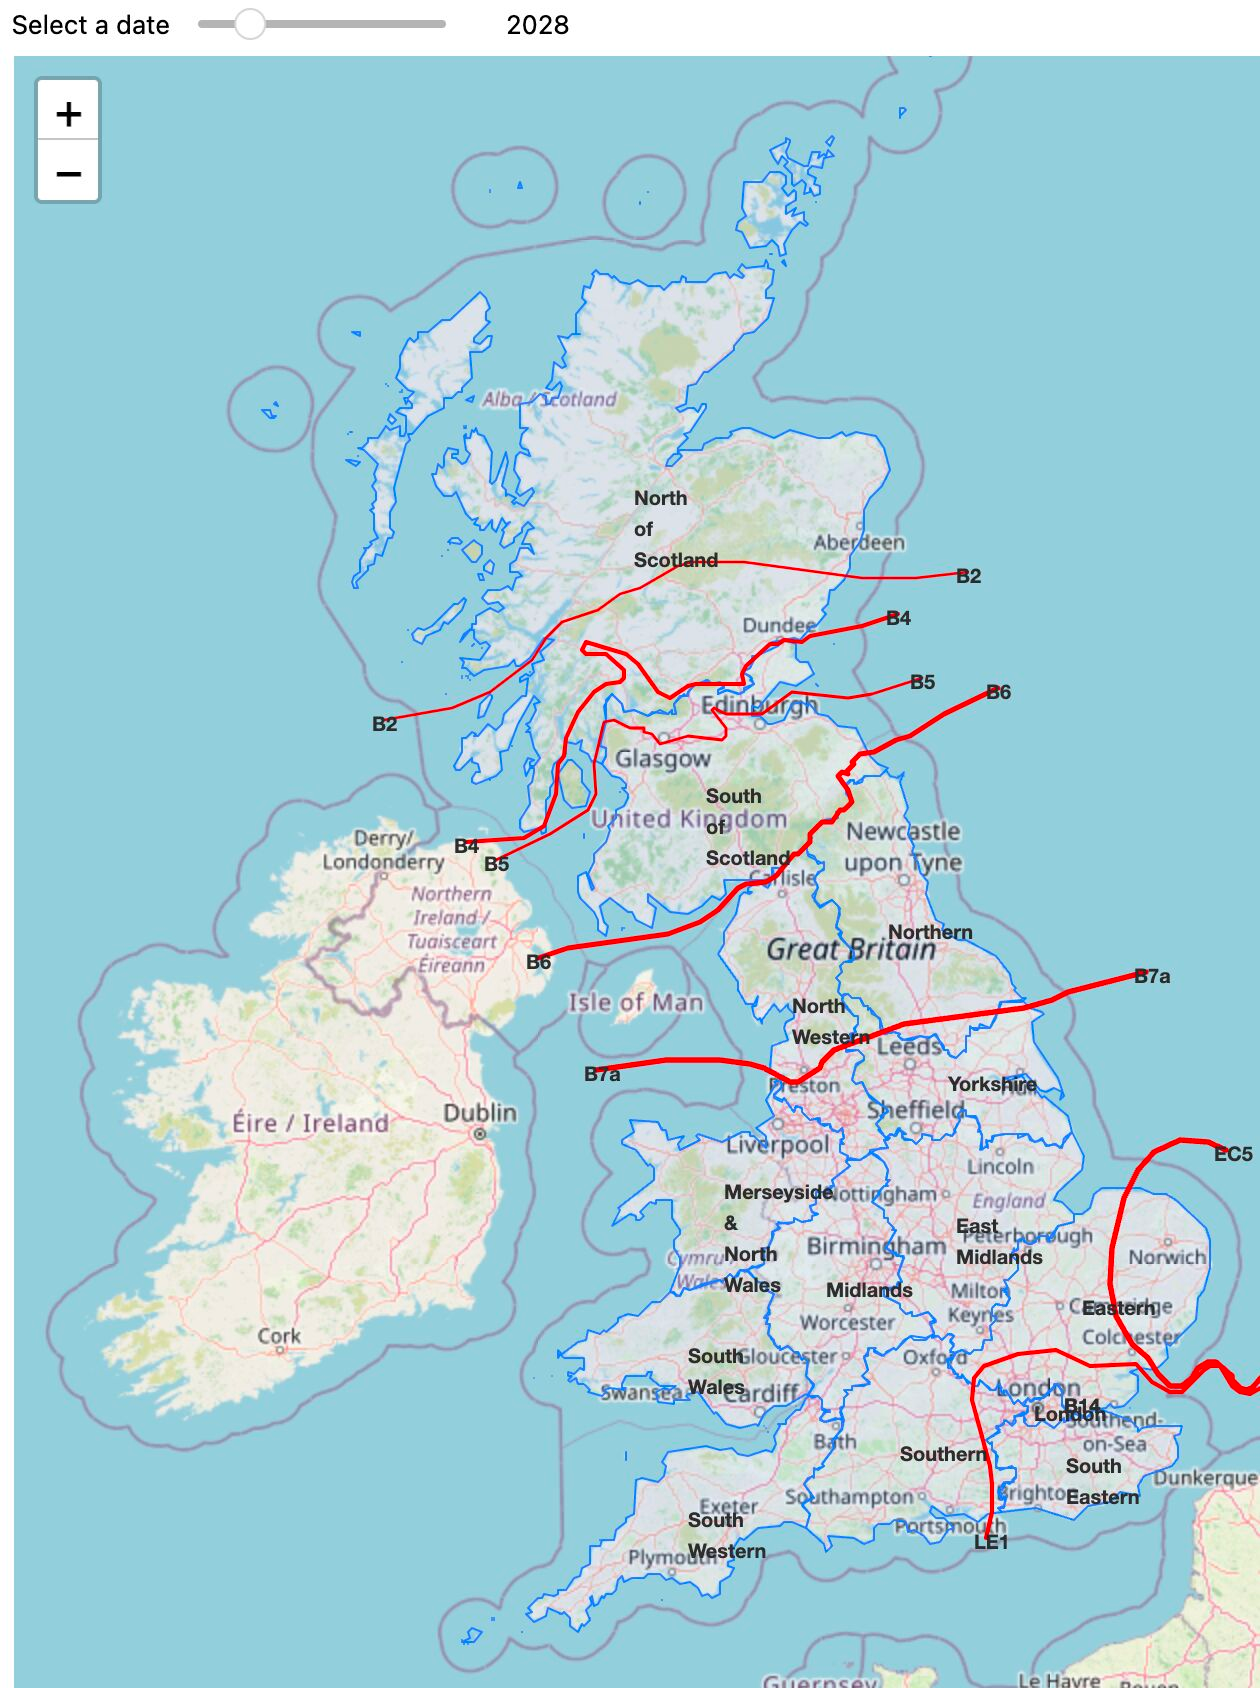
Most of GB’s wind generation is (and will be) in Scotland, while most electricity demand is in England. The transmission network — particularly the B6 boundary (representing the constrained cable between Scotland and England) — cannot always carry all the power that needs to flow south.
When this happens, the grid operator must:
- Pay wind farms in Scotland to reduce output (bids) — even when that power is needed
- Pay generators in England to increase output (offers) — to replace the constrained Scottish power
Batteries positioned near these constraints can provide these services and earn significant revenues.
Constraints change over time: 2024, 2028 and 2033
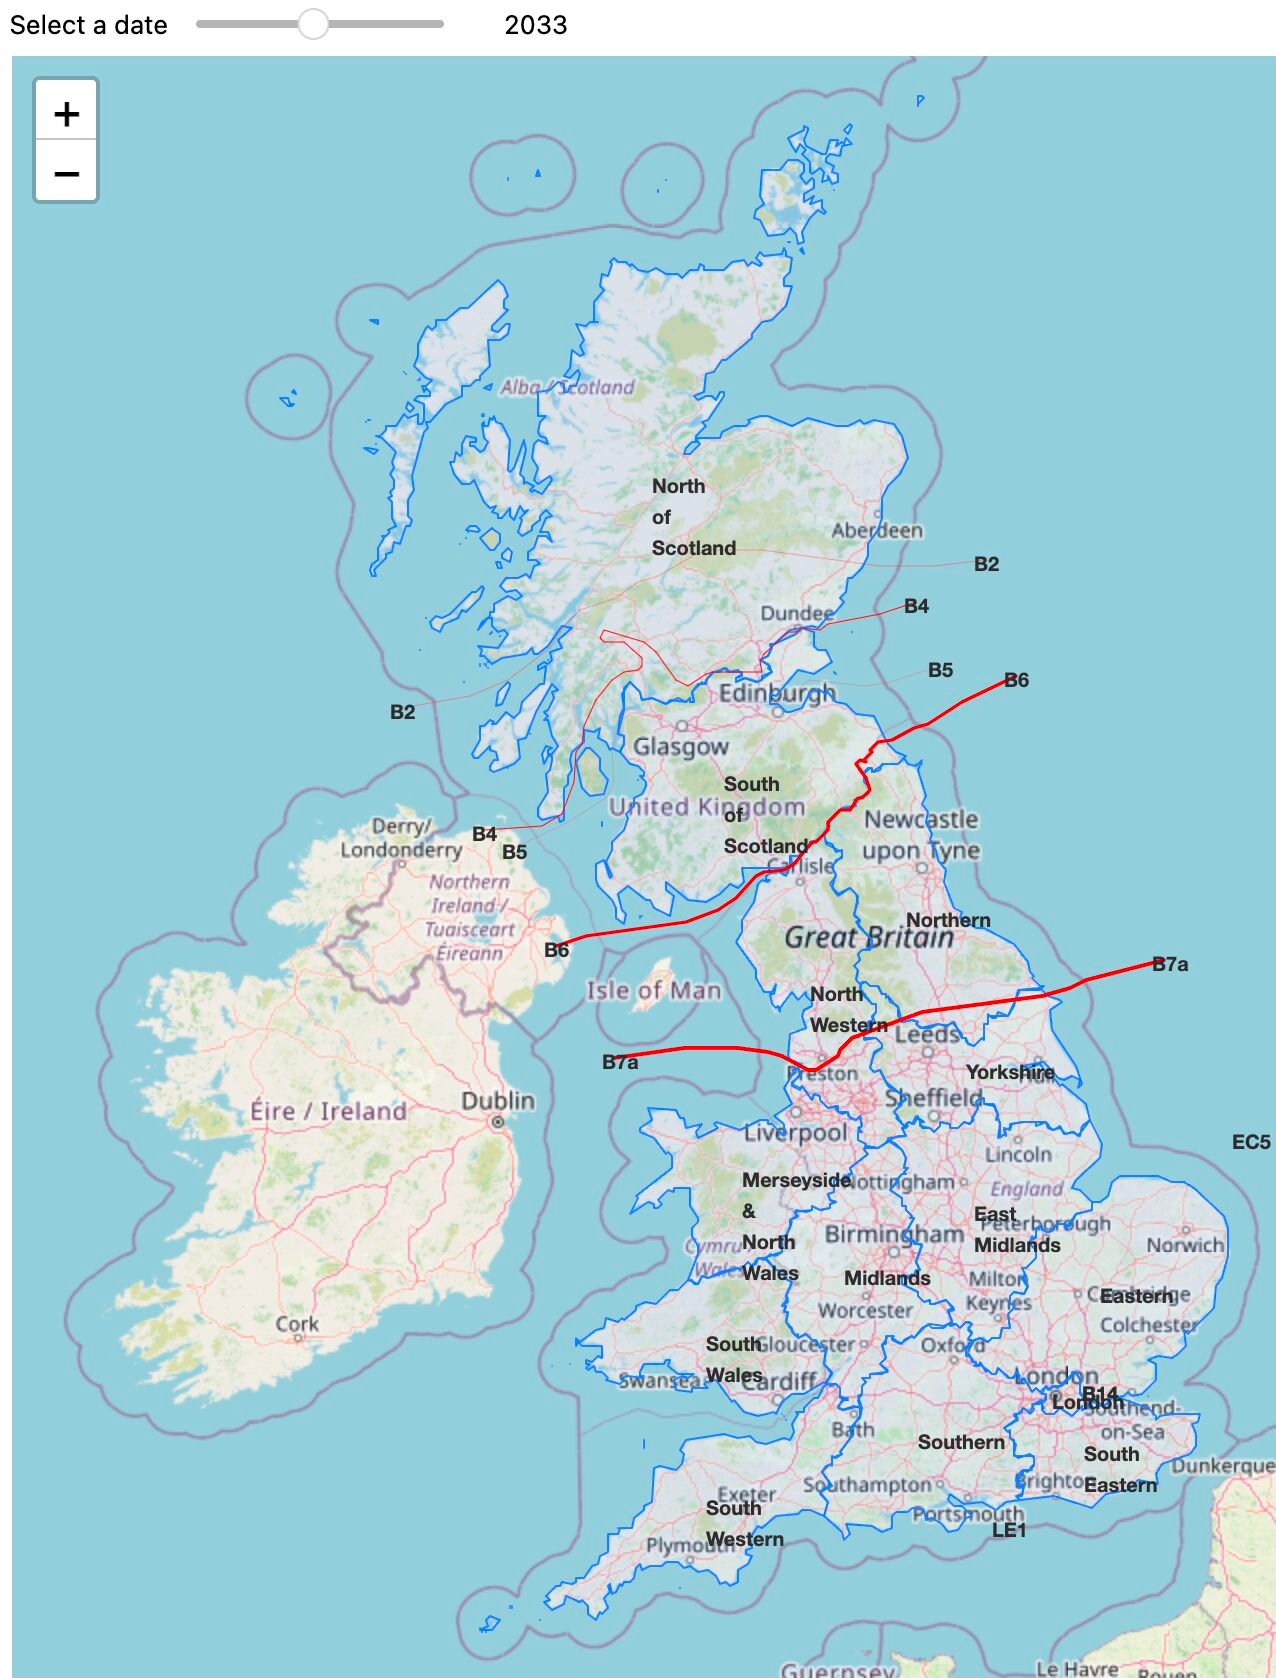
2033: Transmission upgrades ease many constraints, but B6 remains significant.
BM revenues depend on dispatch rates and bid and offer pricing
BM revenues depend on two factors:
- Dispatch rate: How often the battery gets called to provide bids or offers
- Bid-offer prices: What the battery gets paid when dispatched
It’s not Scotland but London and the South East get the highest revenues
London and the South East consistently offer the best BM opportunities:
- High demand concentration: London is the largest demand centre in GB
- Interconnector flows: Multiple interconnectors to Europe create import/export swings that need balancing
- Both bids and offers needed: Unlike Scotland (mostly bids) or wind regions (mostly bids), the South East needs flexible generation for both directions
- Less competition: Fewer large flexible assets compared to the volume of balancing actions required
The daily shape of demand patterns mean constraints in the South East do not last more than a few hours, unlike wind - where batteries can sit behind an active constraint for days, full of cheap wind energy but unable to discharge. This, plus offer pricing typically having a greater spread with the wholesale price than bid pricing, means London and the South East have the highest BM revenues.
Dispatch rates vary significantly by region
Dispatch rate measures how much of a battery’s available capacity gets used for BM actions.
Modo Energy’s dispatch rate is similar to a skip rate which is often discussed in industry. We report on monthly dispatch rates, which are simpler to calculate. With reducing ‘skip rates’ we see higher dispatch rates.
A 10 MW battery with a 25% dispatch rate would provide 2.5 MW of BM services on average.
The charts below are interactive—hover over data points to see exact values.
Battery dispatch rates have are improved
Battery dispatch rates in the BM have doubled over 2024, driven by improvements to the Open Balancing Platform (OBP) — control room technology that helps batteries get dispatched on a level playing field with other technologies. In other words, skip rates have improved.
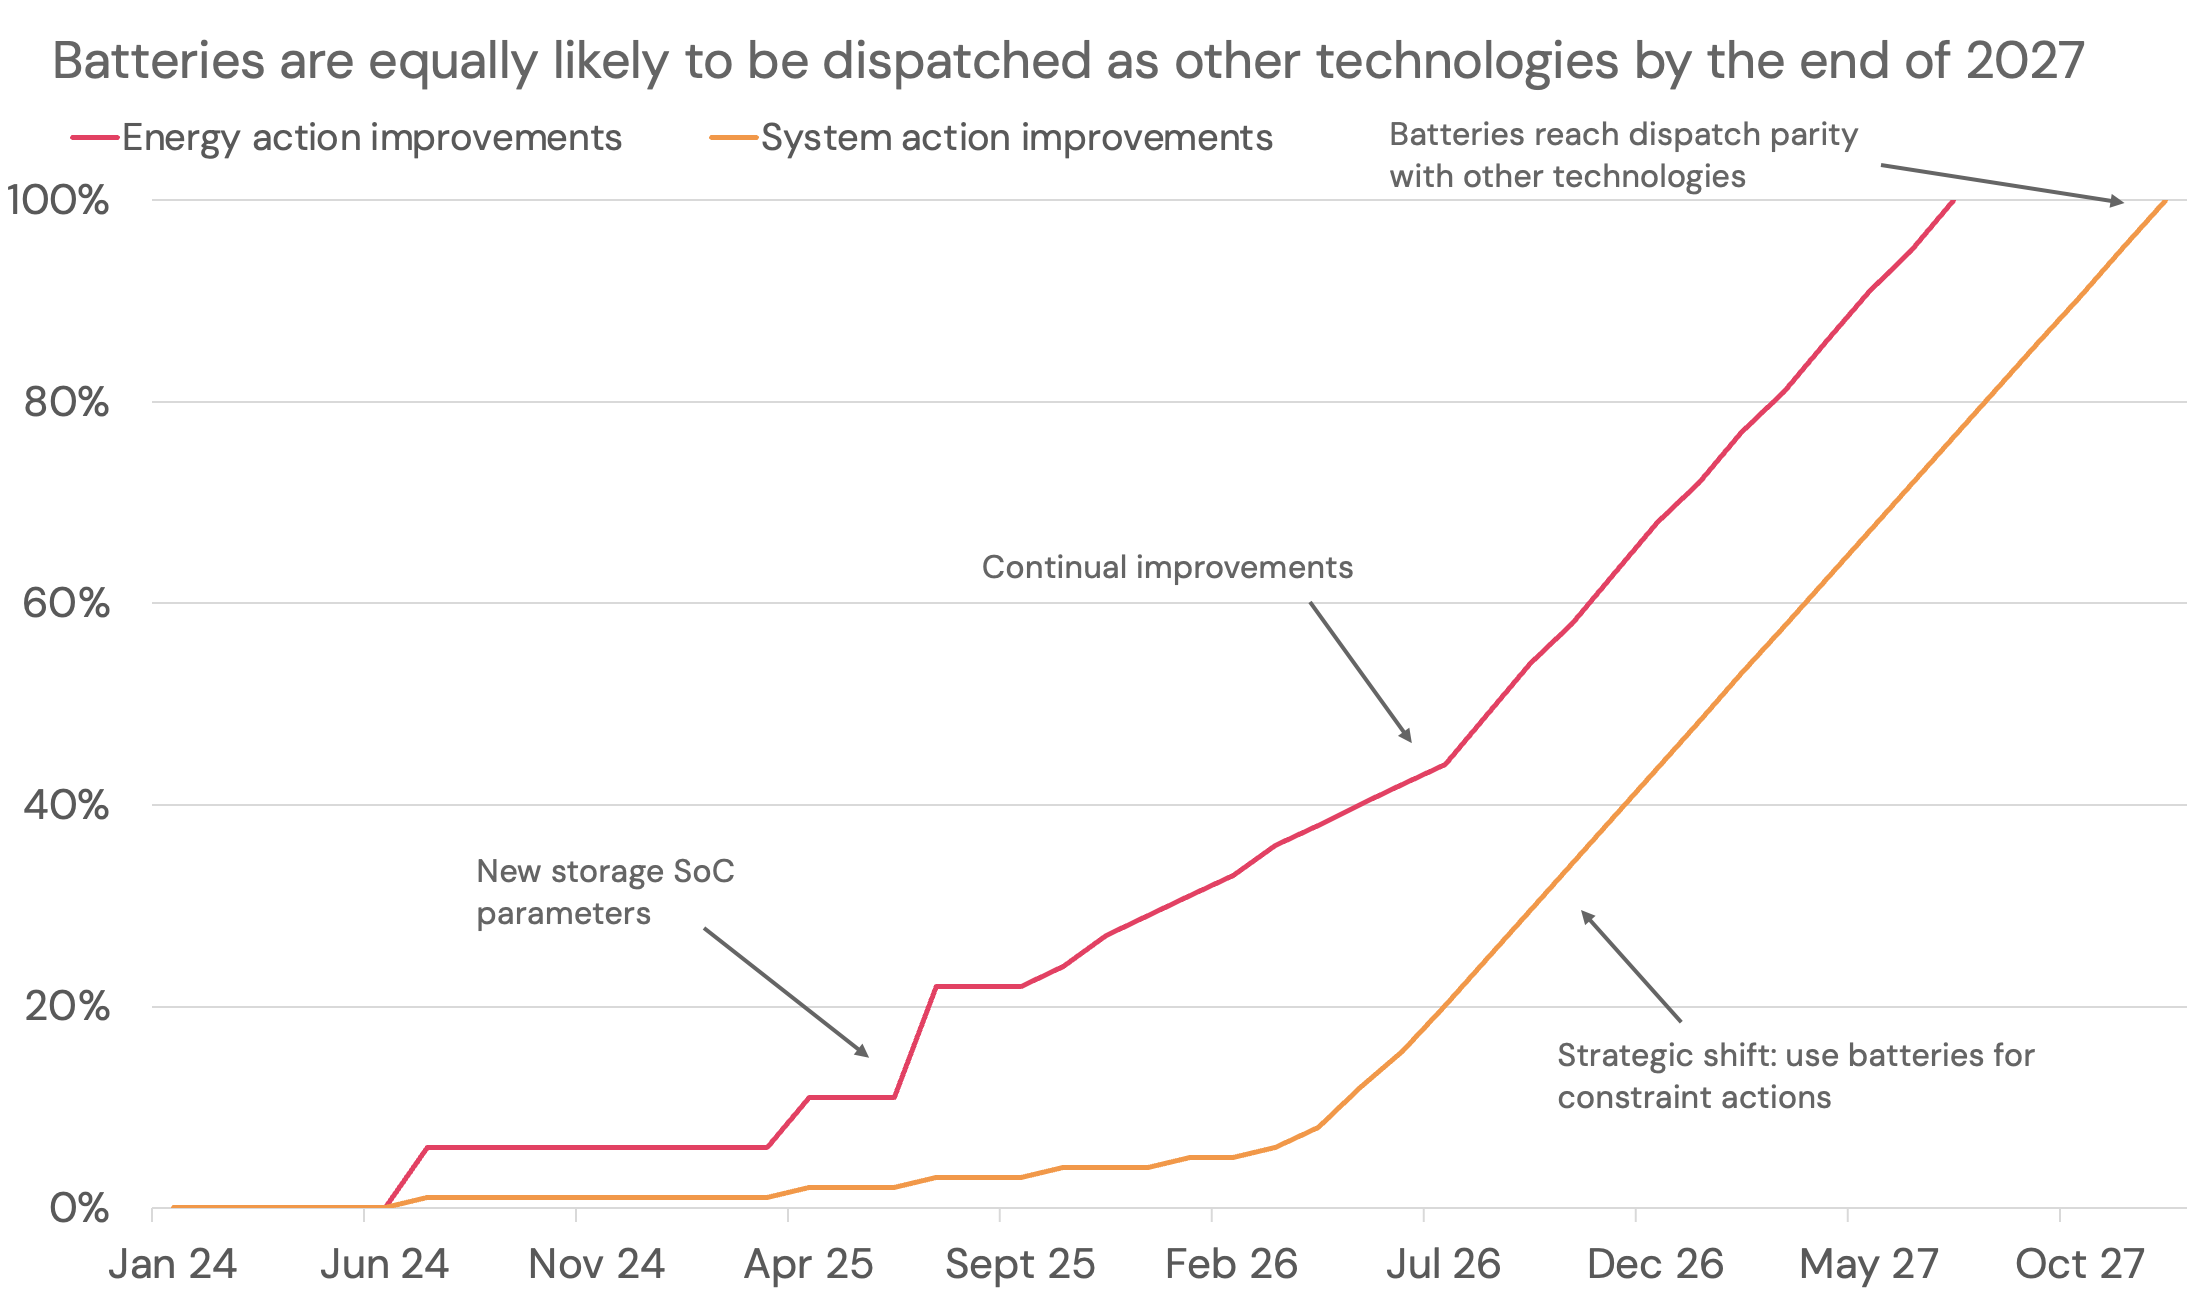
By 2027, batteries are expected to reach “parity” with gas plants — meaning the control room treats them equally for dispatch purposes.
BM revenue modelling follows a three-step process
The forecast models BM revenues in three steps:
Step 1: Estimating market size
The model estimates the volume of balancing actions needed, split into:
- System actions: Resolving physical constraints on the transmission network
- Energy actions: Balancing overall supply and demand mismatches
Step 2: Calculating battery market share
Based on regional dispatch rates and competition from other flexible technologies (gas plants, interconnectors), the model estimates how much of the available BM volume batteries can win.
Step 3: Cross-market optimisation
The dispatch model optimises battery operation across day-ahead, intraday, and BM markets together. BM participation is balanced against wholesale trading opportunities and the cost of rebalancing state of charge.
EXAMPLE PIC
Technical detail: For the full methodology including constraint modelling, dispatch rate calculations, and optimisation approach, see BM Technical Methodology.
BM prices are set nationally with a minimum spread
We model a single bid price and offer price across GB for each half-hour period. This is due to the Transmission Constraint Licence Condition (TCLC), which means generators in constrained regions cannot price their BM actions outside of normal market prices.
The model assumes a minimum spread of £50/MWh between bid and offer prices, based on historical data.
Example week of modelled bid and offer prices.
Policy reforms may change future BM dynamics
Several policy reforms are in progress that could change how the BM operates:
- P462: This would mean batteries cannot have negative bid prices. More info here
- GC0166: As part of OBP, the control room would see state of charge information about connected storage assets. This should improve dispatch volumes. Other operational changes NESO plan to make are discussed here.
The forecast is based on current market structures. Scenario analysis can explore alternative policy outcomes.
Data sources
The BM model uses data from:
| Input | Source |
|---|---|
| Transmission capability forecasts | Electricity Ten Year Statement (ETYS) — “Leading the Way” scenario |
| Historical dispatch rates | Modo Energy analysis of BM data |
| Flexible generation capacity | DUKES, Regional Future Energy Scenarios |
| Bid-offer price relationships | Modo Energy fundamental price model |