The Modo Energy GB and European forecast of power prices and battery revenues updates every quarter. Here is a summary of the changes from one version to the next.
January 2026 release (update from October 2025)
Key changes:
– in GB, 3-6% reduction in battery revenues, driven primarily by a lower GB wind buildout reducing Balancing Mechanism opportunities.
– in Germany, there is ~1% reduction in day ahead revenues.
Market pricing model updates
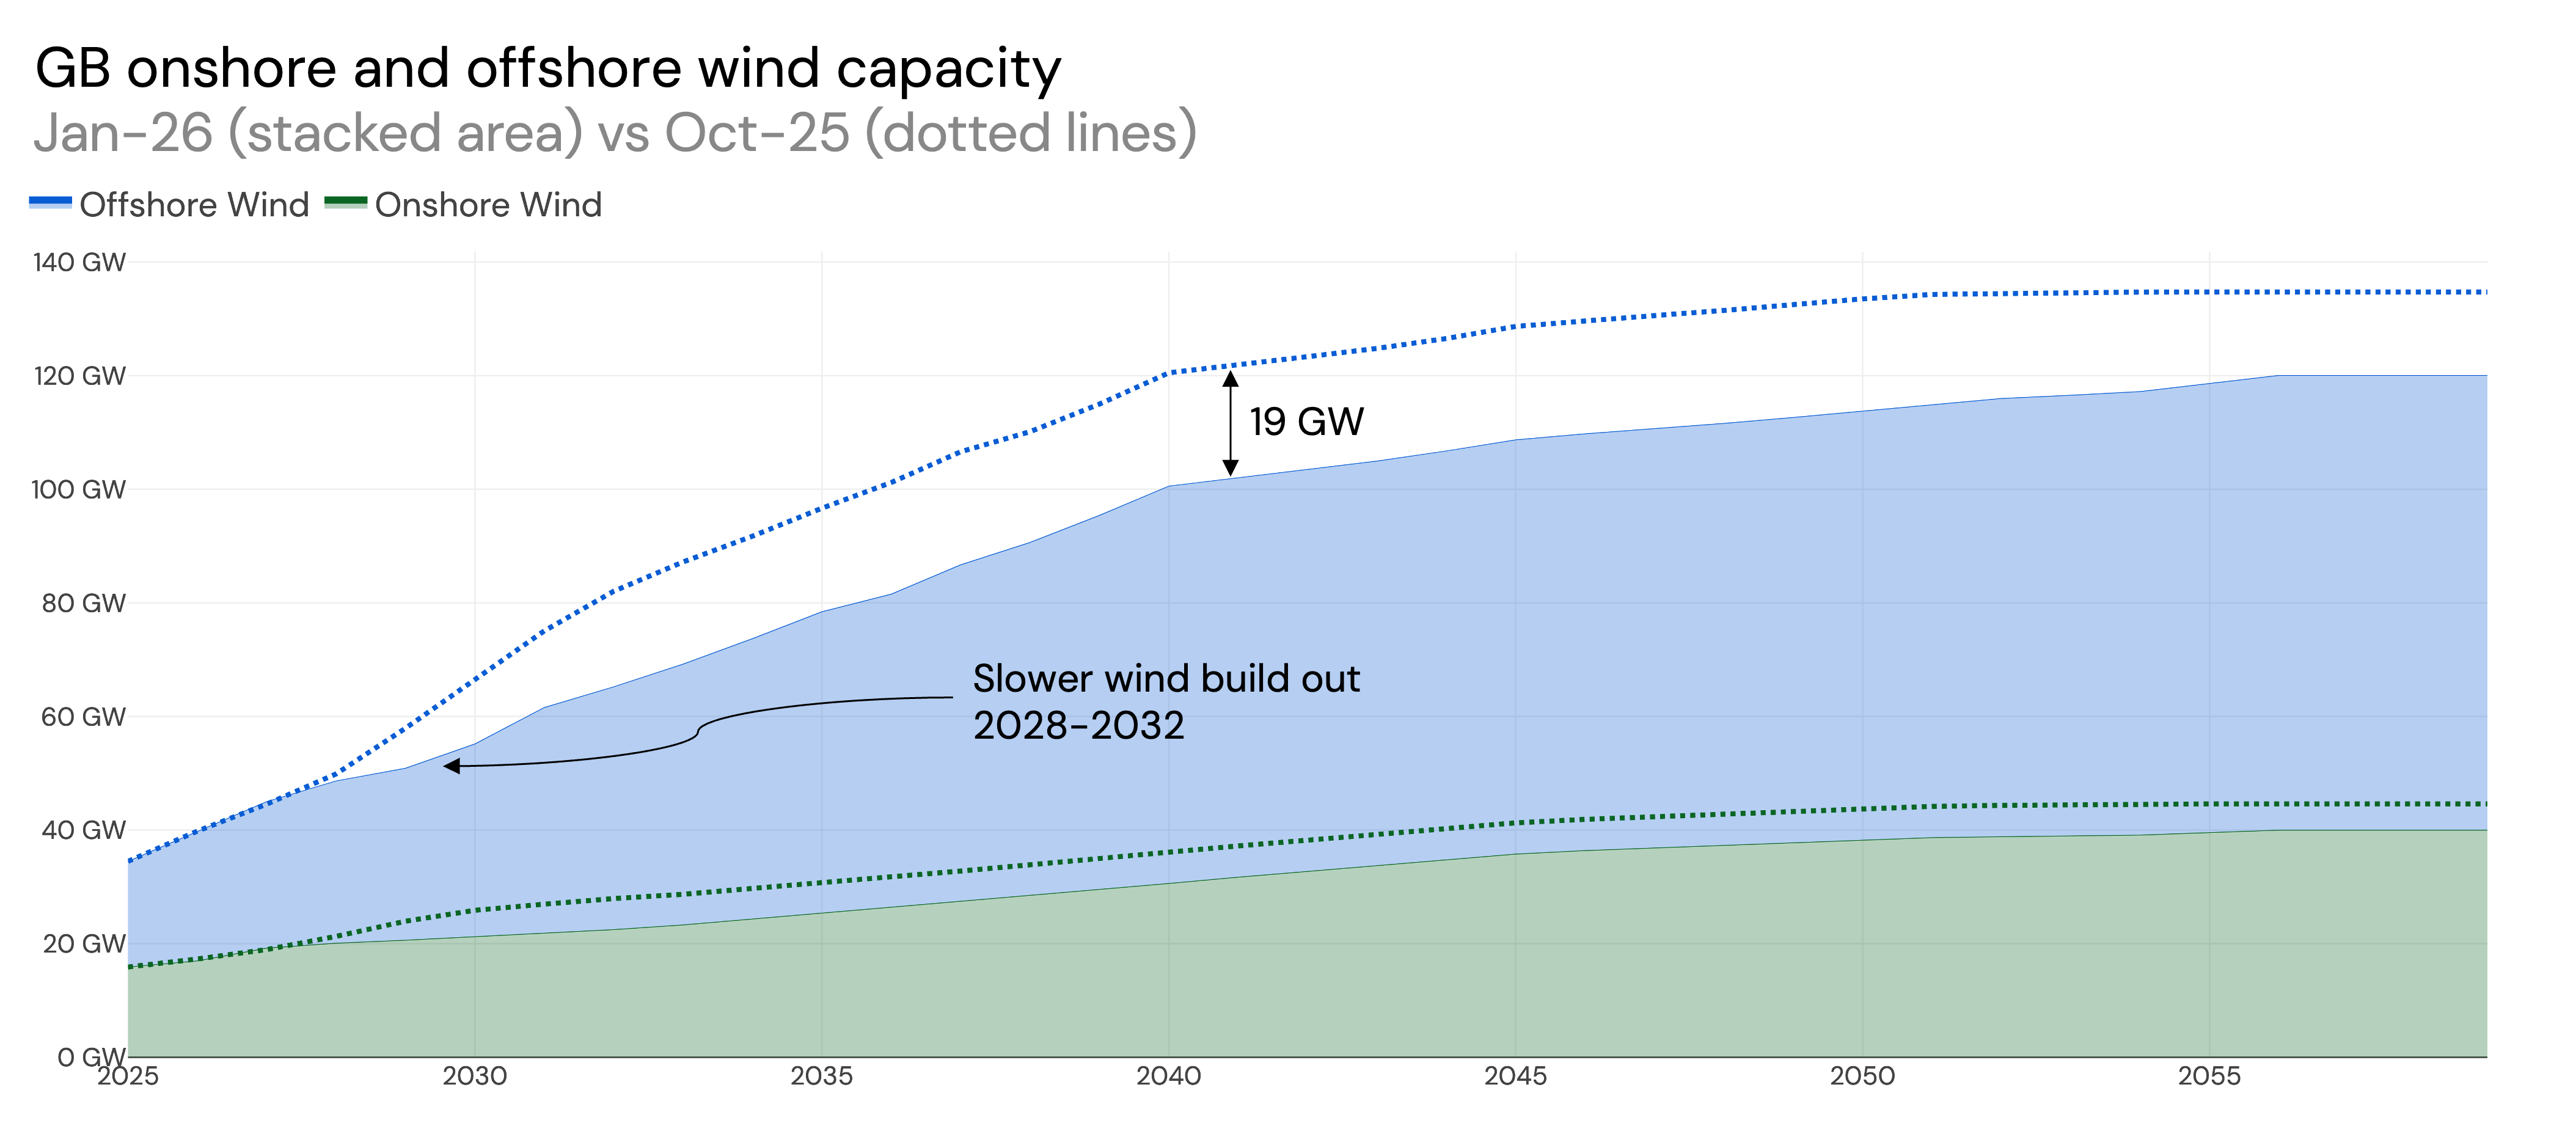
- Updated the wind buildout based on the latest Contracts for Difference auction results (AR6 and AR7). A slower build of wind, and removal of Hornsea 4, means GB now has 19 GW less offshore wind capacity in the 2040s compared to the previous forecast.
- Price impact: Power prices increase, but day-ahead spreads remain consistent as the low price continues to be set by wind generation.
- Revenue impact: Lower wind capacity reduces Balancing Mechanism volumes, leading to lower BM revenues for batteries. This particularly affects longer duration systems with higher cycling, as these assets typically derive more revenue from the BM.
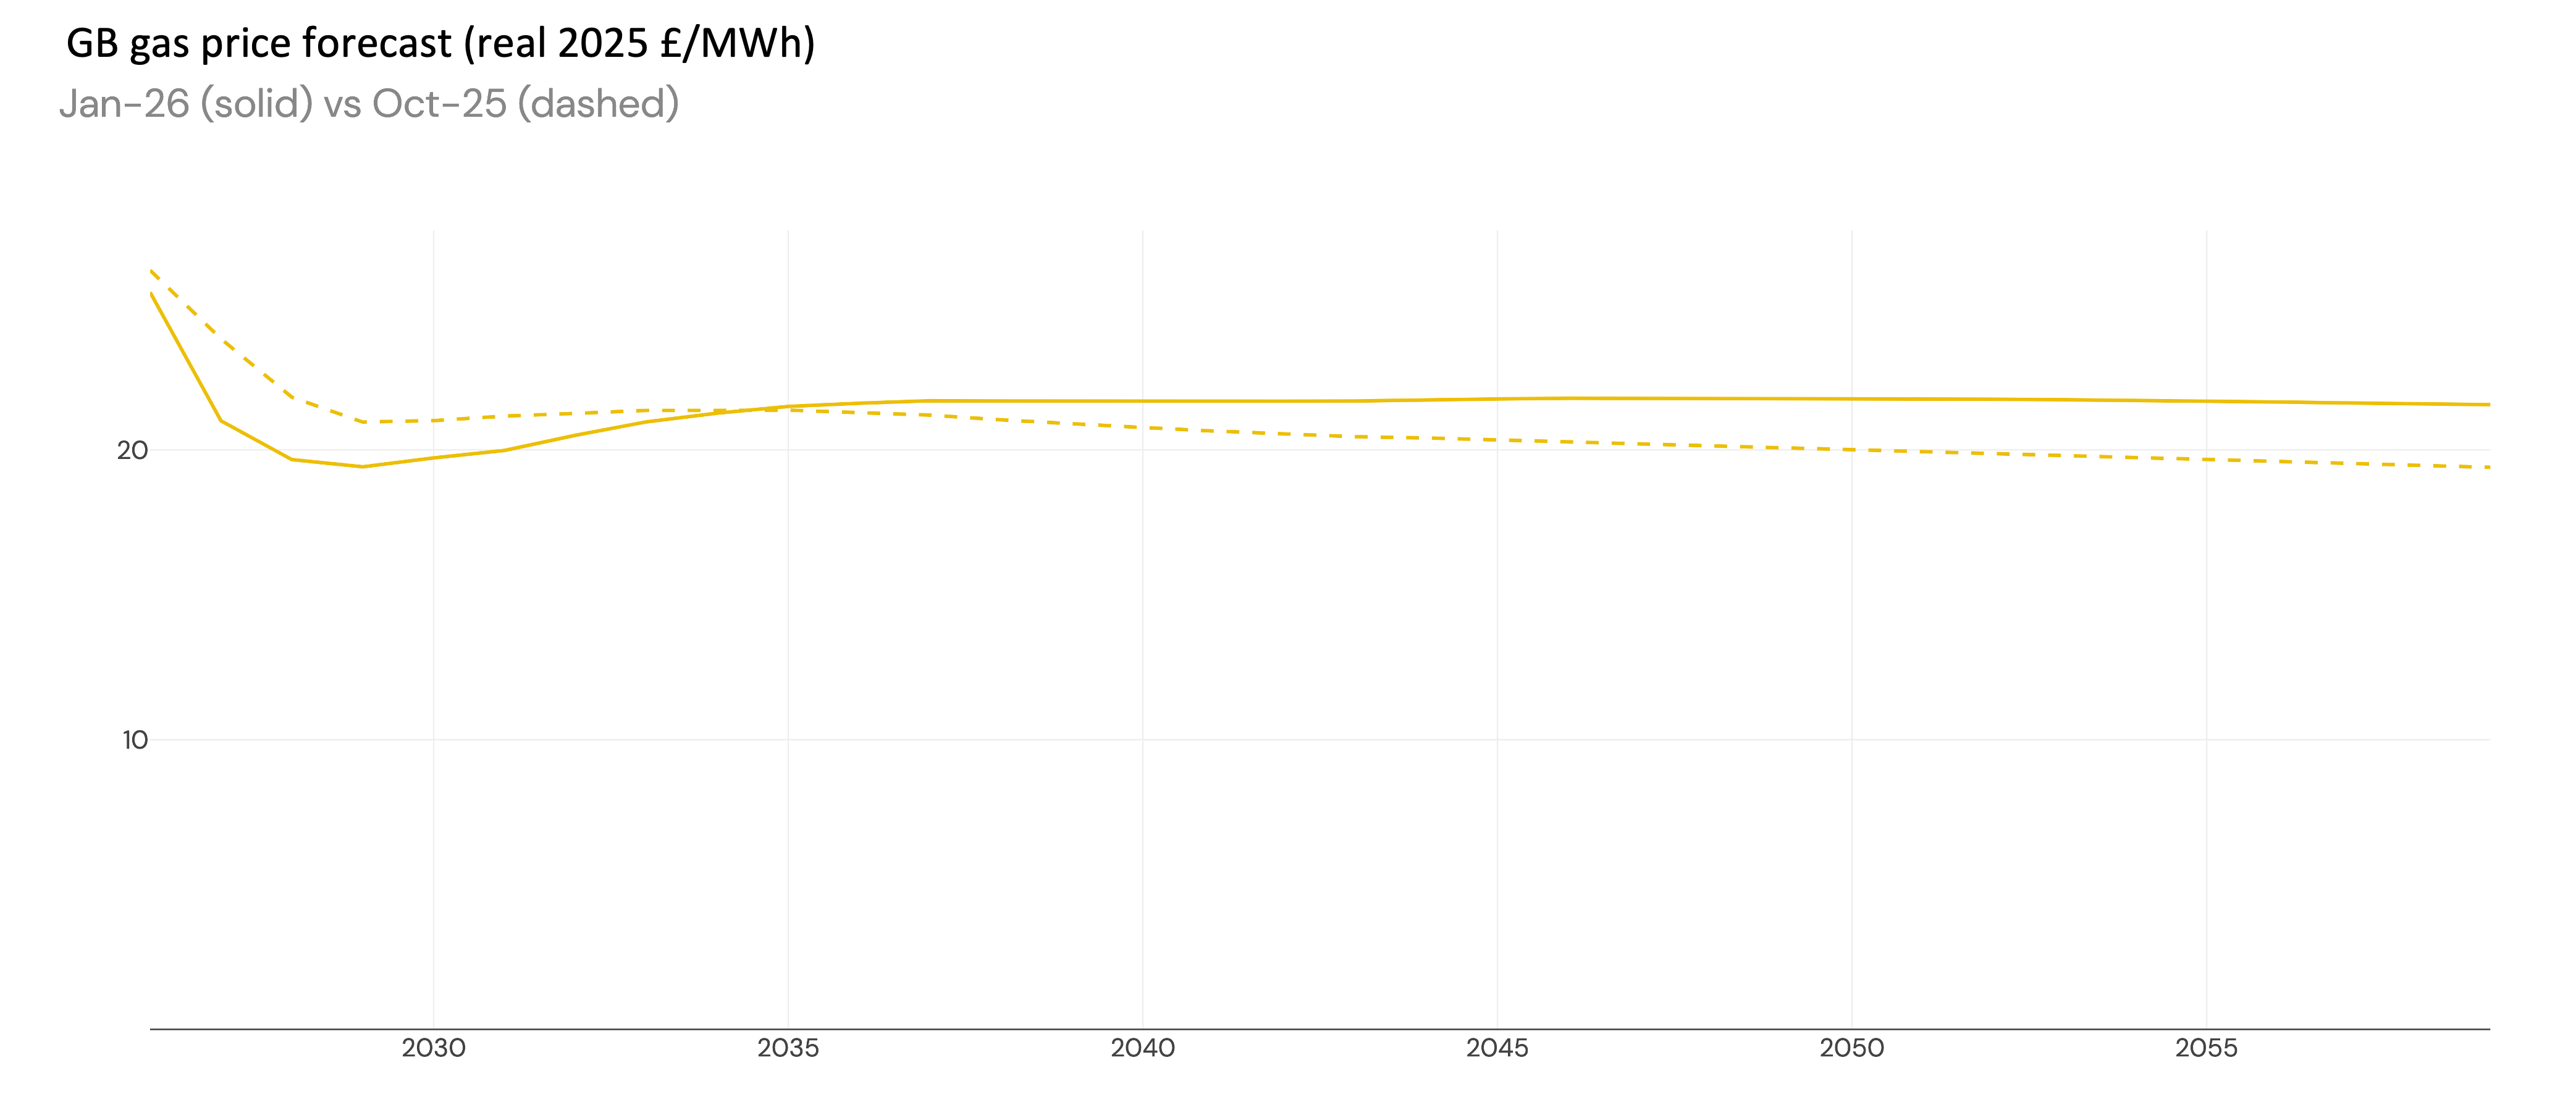
- Updated commodity prices.
- Gas: Aligning with the latest market forward curves, the front months are are up and next few years are down. Longer term, the gas price is up due to updated external forecasts.
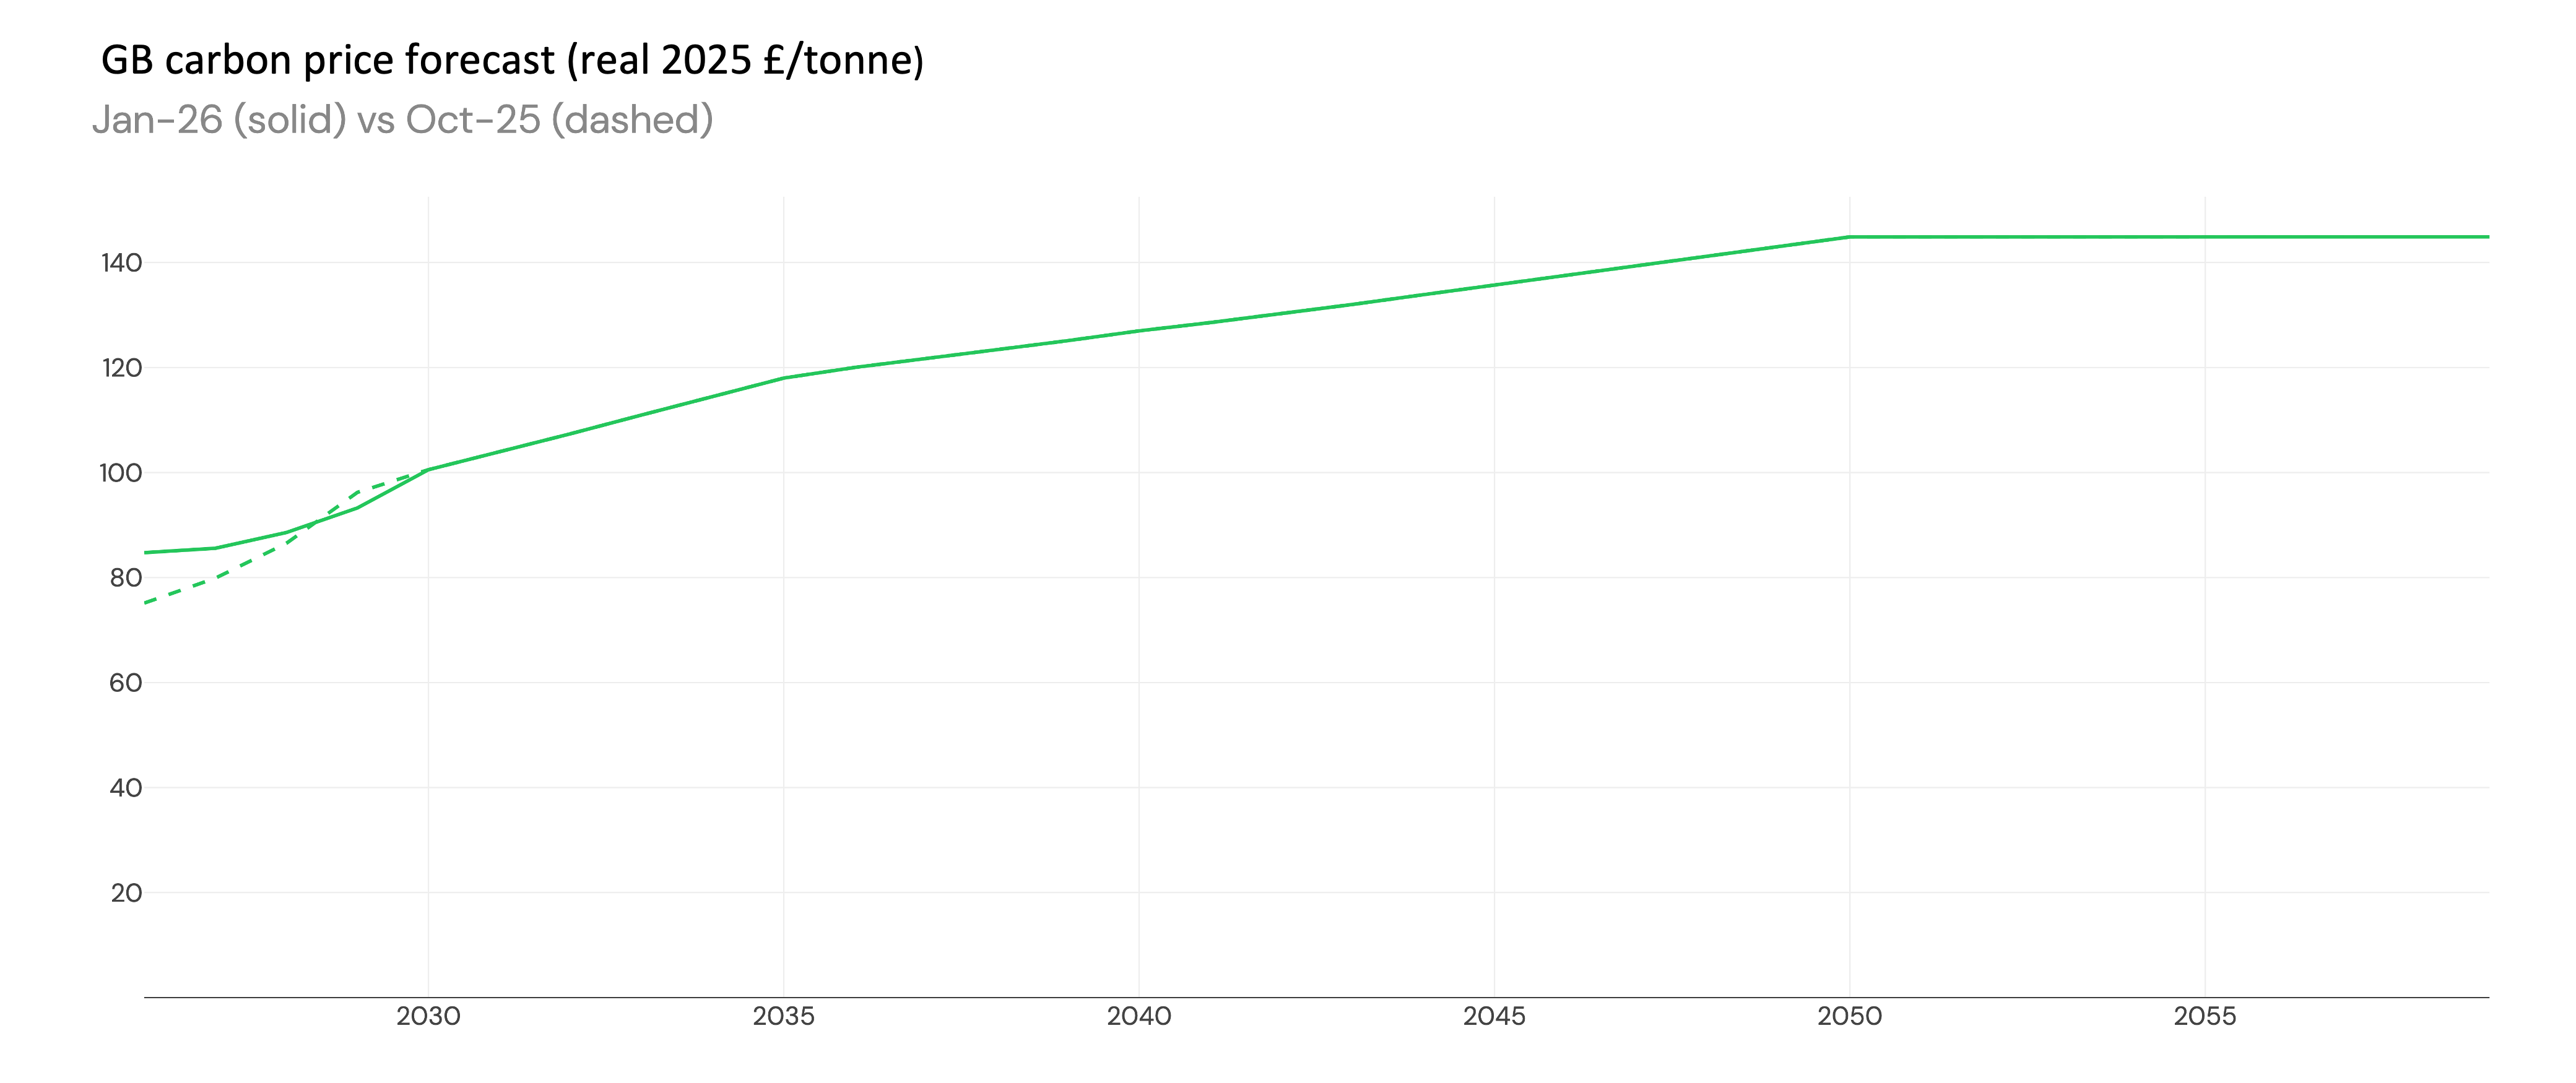
- Carbon: Aligning with the latest market forward curves, first few years are up and longer term view is the same.
-
Revised the nuclear buildout in Spain: a small amount of nuclear capacity is now expected to remain online until 2050.
-
Shorter duration batteries in Germany get augmented, so that 1h systems are repowered into longer duration systems.
Dispatch model updates
-
Updated calibration of GB assets with the latest backtest. See Model Assumptions for more info.
-
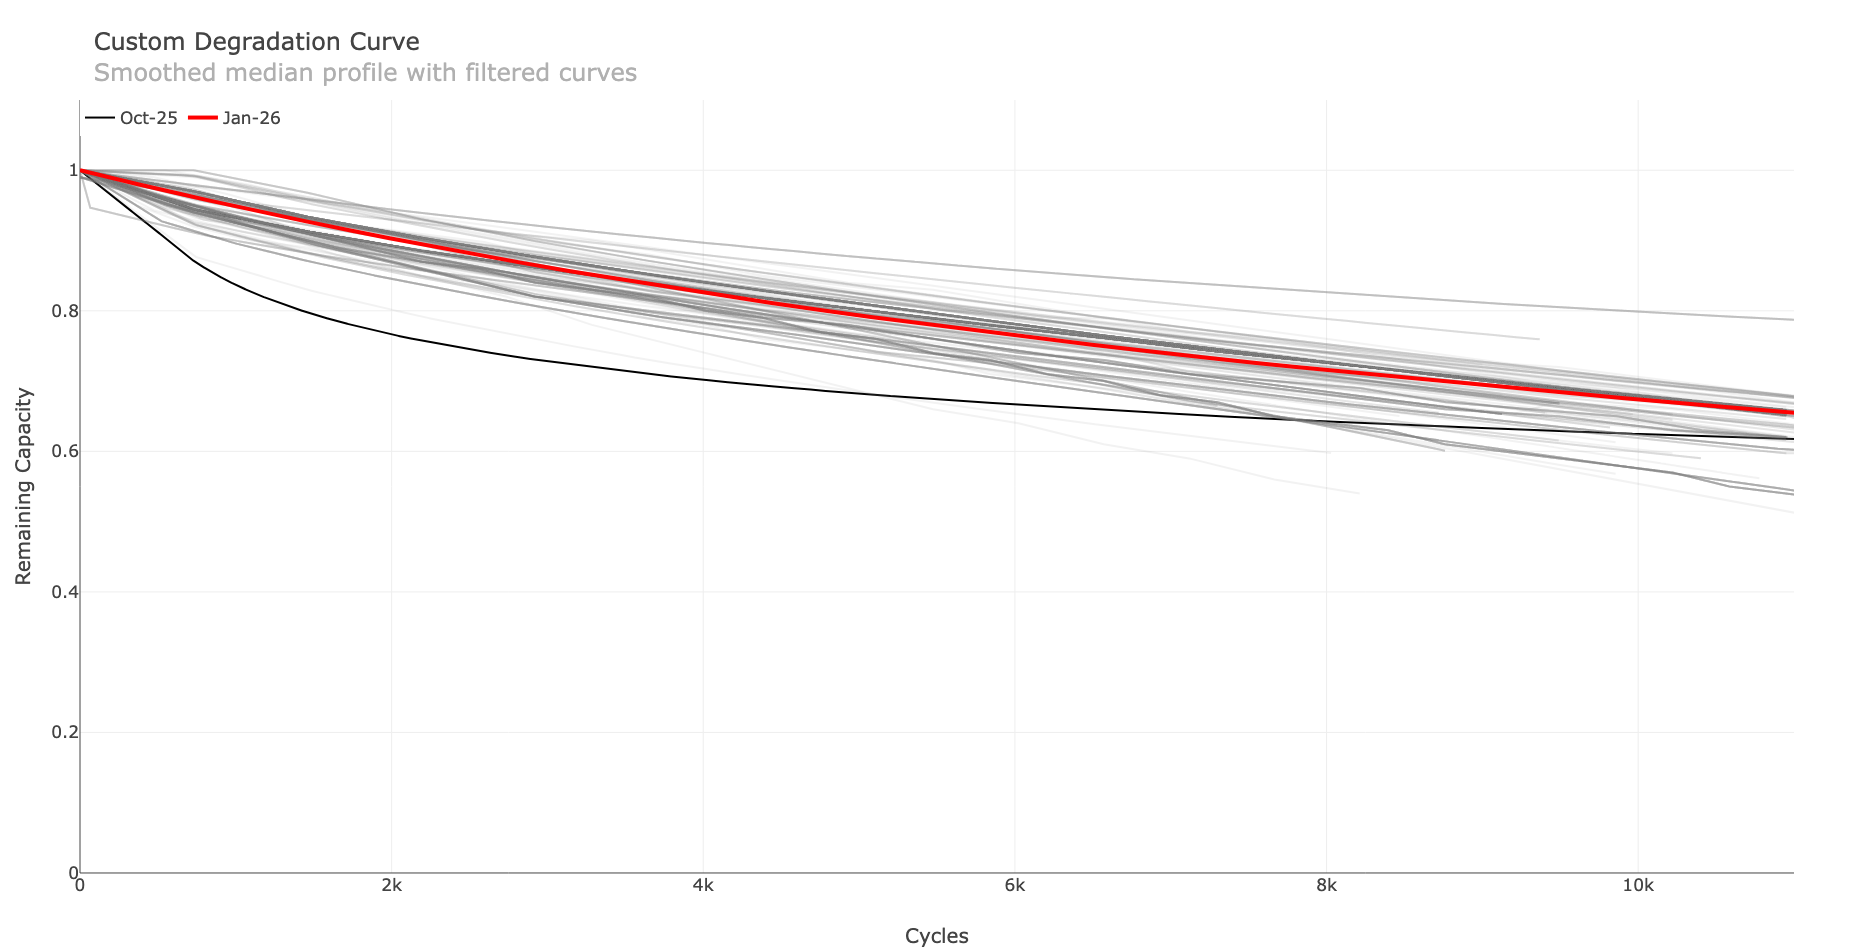
Updated the default degradation curve using recent market data. Technology improvements mean batteries degrade less than previously assumed. The repowering logic has also been updated so that timelines for battery sites repowering are more accurate. This particularly impacts constrained sites, where previously they would repower early.
New features
-
As curtailment is becoming increasingly common in connection offers, understanding its impact is critical. You can now upload custom grid curtailment profiles to the terminal, allowing batteries to optimise import and export around any curtailment constraints.
-
Solar degradation can now be applied to solar forecasts in the terminal: the default is a 0.5% reduction in solar capacity per year.
-
To capture nuances of how co-located battery and solar sites are optimised on the ground, there are now customisable operating modes within the terminal. Options include forcing solar export, exporting solar only when power prices are positive, or full flexibility to maximise total site revenue.
October 2025 release (update from v3.5)
This release includes broad changes to the model architecture. The user experience via the terminal remains the same.
-
The model has expanded from a national model of Great Britain with four simplified interconnected regions to a zonal model covering 15 regions across Europe in greater detail.
-
New inputs are now used from various EU-wide sources and individual country data.
-
An improved Capacity Expansion Model covers Europe, incorporating current policy decisions across all 15 regions while letting project economics determine the rest.
-
The forward curve has been extended to 2060 (from 2050).
-
Improved handling of fleet storage better manages price-setting behaviours as storage fleets grow. Prosumer batteries are now explicitly modelled.
-
The model now runs at 15-minute granularity (previously 30-minute in v3.5), aligning with European markets. In GB, results are rolled to 30-minute granularity to match the settlement window.
-
Revenue forecasts are now available for Germany and Spain in addition to Great Britain, covering all expected revenue streams for battery energy storage in these regions.
-
A new documentation site provides transparency across all forecast regions. The previous version of the documentation remains available here.
Previous updates to the GB forecast
See the previous Changelog here.