Key takeaway: The NEM fundamentals model produces 5-minute granularity price forecasts across 9 substates to 2054, capturing the supply-demand dynamics and bidding behaviour that drive wholesale electricity prices.
Here we go into details on our NEM Fundamentals Model. We utilise the same overall framework that powers all of Modo Energy's forecasts. For details of this Core Model, click here.
Our NEM forecast is a 5-minute granularity, substate model that produces outputs to 2054. The forecast models demand, generation, constraints and ultimately prices at a 5-minute settlement period level, which in turn are used as inputs to our battery dispatch model.
The model runs off assumptions of demand, generation capacities, storage capacities, bidding behaviour, transmission capacities, and outages. We have rigorously tuned our fundamentals model against historical prices to accurately reflect price-setting behaviour. We specifically focus on modelling volatility as a core part of our model, as those periods are especially important to storage revenues. We do this by modelling at 5-minute granularity and by accounting for all types of bids from generators:
- Bids close to the price floor to force the unit to stay online
- Bids close to the short-run marginal cost of the unit
- Bids close to the price cap in order to maximise unit or portfolio revenue
Substate-level modelling
To reflect regional dynamics within the NEM, we model at the substate level and consider transmission limits between substates. We divide the five NEM states into nine distinct regions, based on ISP Subregions. These allow us to capture the main transmission constraints in the NEM in order to model curtailment, and also gives us local prices which can be used to constrain batteries in our dispatch model. These substates are as follows:
- North, Central, and South Queensland
- North, Central, and South New South Wales
- Victoria
- South Australia
- Tasmania
5-minutely pricing
The model runs at 5-minutely granularity to build a full 5-minute time series of energy and FCAS prices through to the end of the model. Modelling at 5-minute granularity is critical to capturing some of the main drivers of price volatility within the NEM, as well as maximising the value that battery energy storage can capture from this.
What are the core inputs?
The model uses a range of inputs, primarily Modo Energy’s independently developed market outlook. This is informed by other sources, including data from NEMWEB and AEMO’s Integrated System Plan (ISP). We update to use the latest ISP data whenever new draft or final versions become available. This outlook is grounded in rigorous market research and informed by deep industry expertise, providing a nuanced view of the future electricity market and capacity landscape. Find out more information by heading to the sub-page for each section.
| Category | Key input sources |
|---|---|
| Demand | AEMO 2024 ISP Demand traces, AEMO 2024 Electricity Statement of Opportunities (ESOO), AEMO MMS, NEMWEB |
| Generation | AEMO 2024 ISP, AEMO 2025 IASR, AEMO April 2025 Generation Information, AEMO MMS |
| Transmission | AEMO 2024 ISP, AEMO Network outage detail |
| Commodity prices | AEMO 2025 IASR, AEMO Daily STTM reports, AEMO DWGM Victorian Wholesale Price, ASX Gas and Coal Futures |
| Renewable load factors | AEMO 2024 ISP, AEMO 2025 IASR, AEMO MMS |
| Marginal loss factors | AEMO Marginal Loss Factors |
| Community energy resources | AEMO 2025 IASR Draft, Clean Energy Regulator, NEMWEB |
| Capex and opex | AEMO 2025 IASR (generation), Modo Energy GB v3.5 (BESS Central/Low), CSIRO GenCost 2024/25 (BESS High) |
Volatility
How we model price volatility in the NEM
Weather Years
Weather year selection and renewable generation profiles
Unit Commitment Model
Generator commitment and dispatch optimization
Demand
Electricity demand forecasting and assumptions
Generation and Storage
Generation capacity buildout and storage modelling
Transmission
Transmission network constraints and flows
FCAS
Frequency Control Ancillary Services modelling
FCAS Islanding
Modelling FCAS requirements during islanding events
Scenario Modelling
Different market scenarios and sensitivities
Administered Pricing
How we model administered price caps and interventions
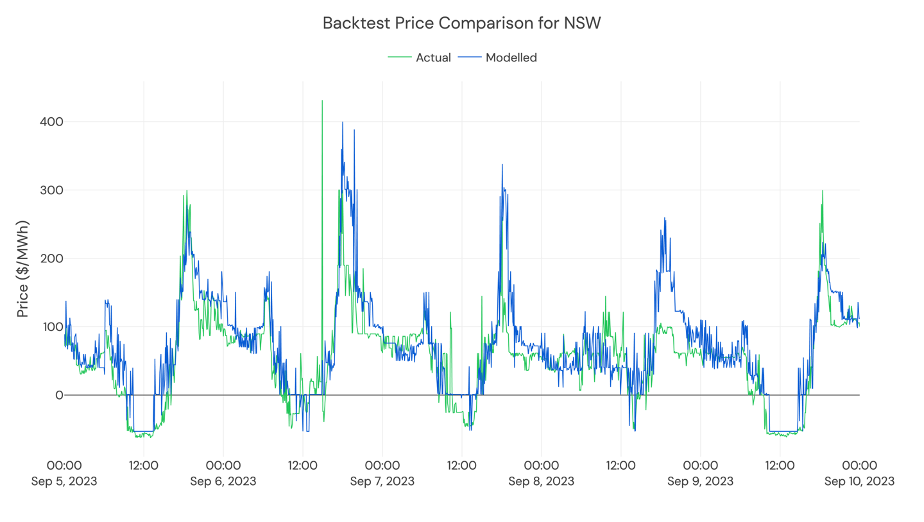
Backtest
Model validation against historical data